Network Demo
The Basics Demo shows the proxy, its dashboard, and Grafana with a perfect network between the agents and the proxy. This second demo puts a simulated WAN there, the link through the firewall that the product exists to cross, and shows what a far, thin, dead, flaky, or missing link does, and how the proxy and agents cope. Every screenshot on this page comes from it.
The WAN is Toxiproxy, with four links: one from each agent to each proxy. Each agent lists its link to the primary proxy first and its link to the standby second, so the dashboards name the link an agent connected through.
%%{init: {'flowchart': {'curve': 'linear'}}}%%
graph LR
  G[Grafana :3100] --> P[Prometheus :9190]
  P -->|discovery and scrapes| Proxy[Proxy, dashboard :8194]
  P -->|discovery and scrapes| Standby[Standby proxy, dashboard :8195]
  %% Each agent connects out, through the WAN, so its arrows point back. The invisible links keep the WAN and the
  %% agents to the right of the proxies, as on the Basics Demo page.
  Proxy ~~~ WAN
  Standby ~~~ WAN
  WAN ~~~ HQ
  WAN ~~~ Branch
  WAN[WAN: Toxiproxy] -->|primary links| Proxy
  WAN -.->|standby links| Standby
  HQ[agent-hq] -->|gRPC| WAN
  Branch[agent-branch] -->|gRPC| WAN
  HQ -->|HTTP fetch| App[network-app: simulated services]
  Branch -->|HTTP fetch| App

  subgraph Outside Firewall
    G
    P
    Proxy
    Standby
  end

  subgraph Inside Firewall
    HQ
    Branch
    App
  end
What you need
The proxy and agent are the latest release's images, from Docker Hub, the same ones the Basics Demo runs, so there's nothing to build. On macOS or Linux, the demo needs only:
- Docker with Compose v2: Docker Desktop, or Docker Engine with the Compose plugin.
git, to clone the repository, and GNUmake. On macOS, the Xcode command-line tools (xcode-select --install) have both. Where GNU make is installed asgmake, typegmakewherever these instructions saymake.curl, which the demo uses to wait for each service to answer.- A web browser.
Running it
Clone the repository at the latest release, then run the demo's commands from its own directory, where make help lists
its targets:
git clone -c advice.detachedHead=false --depth 1 --branch 4.6.0 https://github.com/pambrose/prometheus-proxy.git
cd prometheus-proxy/demos/network
make up      # pulls the images, starts everything, prints the URLs
make tour    # walks through every scenario below, pausing before each step
make down    # stops it and removes its containers and network
The first make up pulls the proxy, agent, Prometheus, Grafana, Zipkin, Toxiproxy, and Python images, which takes a few
minutes. After that it starts in under a minute, and runs without a network connection.
| What | URL |
|---|---|
| Proxy dashboard | http://localhost:8194/dashboard |
| Standby proxy's dashboard | http://localhost:8195/dashboard |
| Grafana (no sign-in needed; admin / admin to edit) | http://localhost:3100 |
| Prometheus | http://localhost:9190 (alerts at /alerts) |
| The proxy's service discovery | http://localhost:8180/discovery |
| Zipkin | http://localhost:9511/zipkin/ |
Each port is the Basics Demo's plus 100, so the two demos can run side by side. Every port binds to 127.0.0.1 only:
the dashboards have no authentication and Grafana keeps its default admin password, which suits a laptop and nothing
shared. To move a port that is already taken, set NETWORK_DEMO_DASHBOARD_PORT, NETWORK_DEMO_STANDBY_DASHBOARD_PORT,
NETWORK_DEMO_GRAFANA_PORT, NETWORK_DEMO_PROMETHEUS_PORT, NETWORK_DEMO_PROXY_PORT, or NETWORK_DEMO_ZIPKIN_PORT,
for example NETWORK_DEMO_GRAFANA_PORT=3101 make up.
What's running
| Service | Role |
|---|---|
proxy |
The proxy, outside the firewall, with its dashboard and service discovery on. |
proxy-standby |
The standby: the same config, with its own dashboard. It serves nothing until an agent can't connect to the primary. |
wan |
Toxiproxy: the four links, hq-to-proxy, hq-to-standby, branch-to-proxy, and branch-to-standby. The proxies see every agent at its address, as they would behind a NAT. |
agent-hq |
The agent at headquarters: two small services and its own metrics. The scenarios that degrade one agent's links leave its links alone, so it is the steady reference. |
agent-branch |
The agent at a branch office: a small shipping service, its own metrics, and an inventory service whose payload is about 496,000 characters, about 56 KB gzipped, so the agent sends it in chunks. |
network-app |
The simulated services. Their traffic follows a 5-minute "day", so the graphs move. |
prometheus |
Scrapes every agent's paths through whichever proxy advertises them, every 5 seconds with a 4-second timeout, and both proxies' own metrics directly, from its own side of the WAN. It loads a few fast demo alerts. |
grafana |
Opens on the demo's dashboard: scrape time per agent, target health, payload size, connects, connected agents per proxy, evictions, bytes a filter saved, and firing alerts. |
zipkin |
Receives a span from every proxy and agent for each gRPC call between them. |
Scenarios
demo.sh, in demos/network, drives the scenarios below. Run it from that directory, where make up started the
demo; each command prints what to watch. The scenarios that change one agent's links change agent-branch's unless
they're given agent-hq, and ./demo.sh heal ends each scenario: it removes every change to the WAN, brings back
every link and proxy, and returns any agent on the standby to the primary.
A high-latency link slows scrapes, but nothing fails
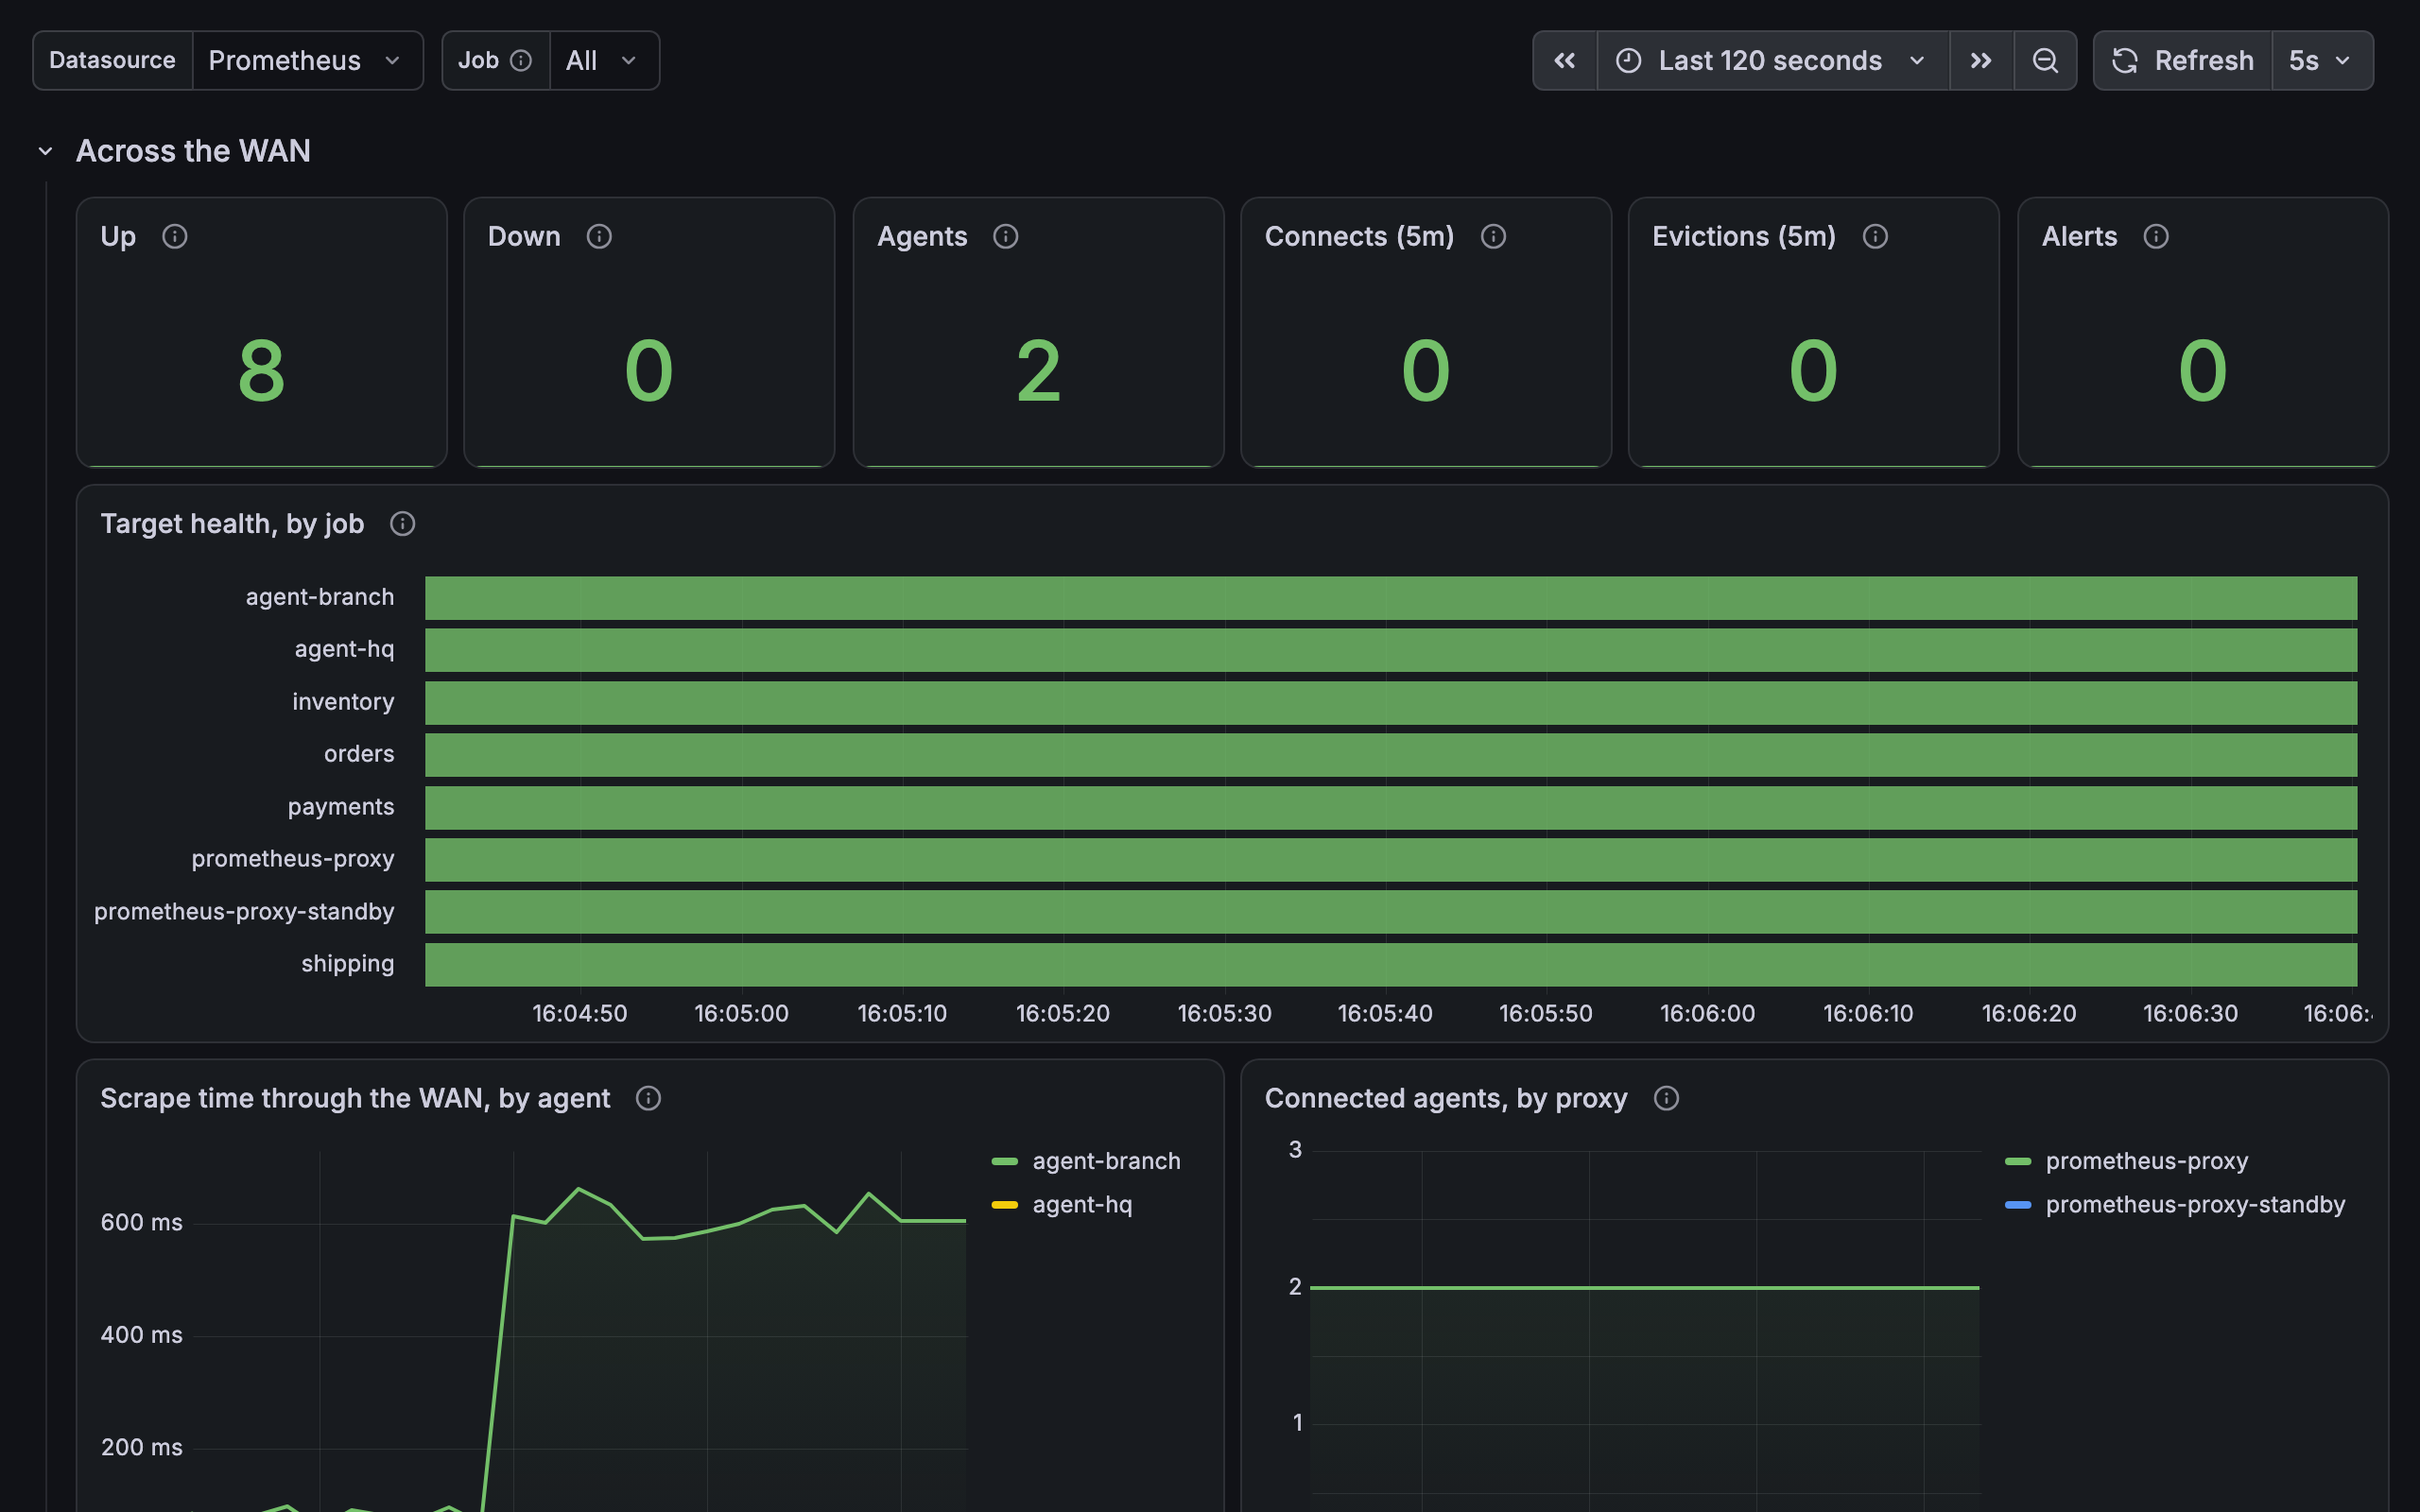
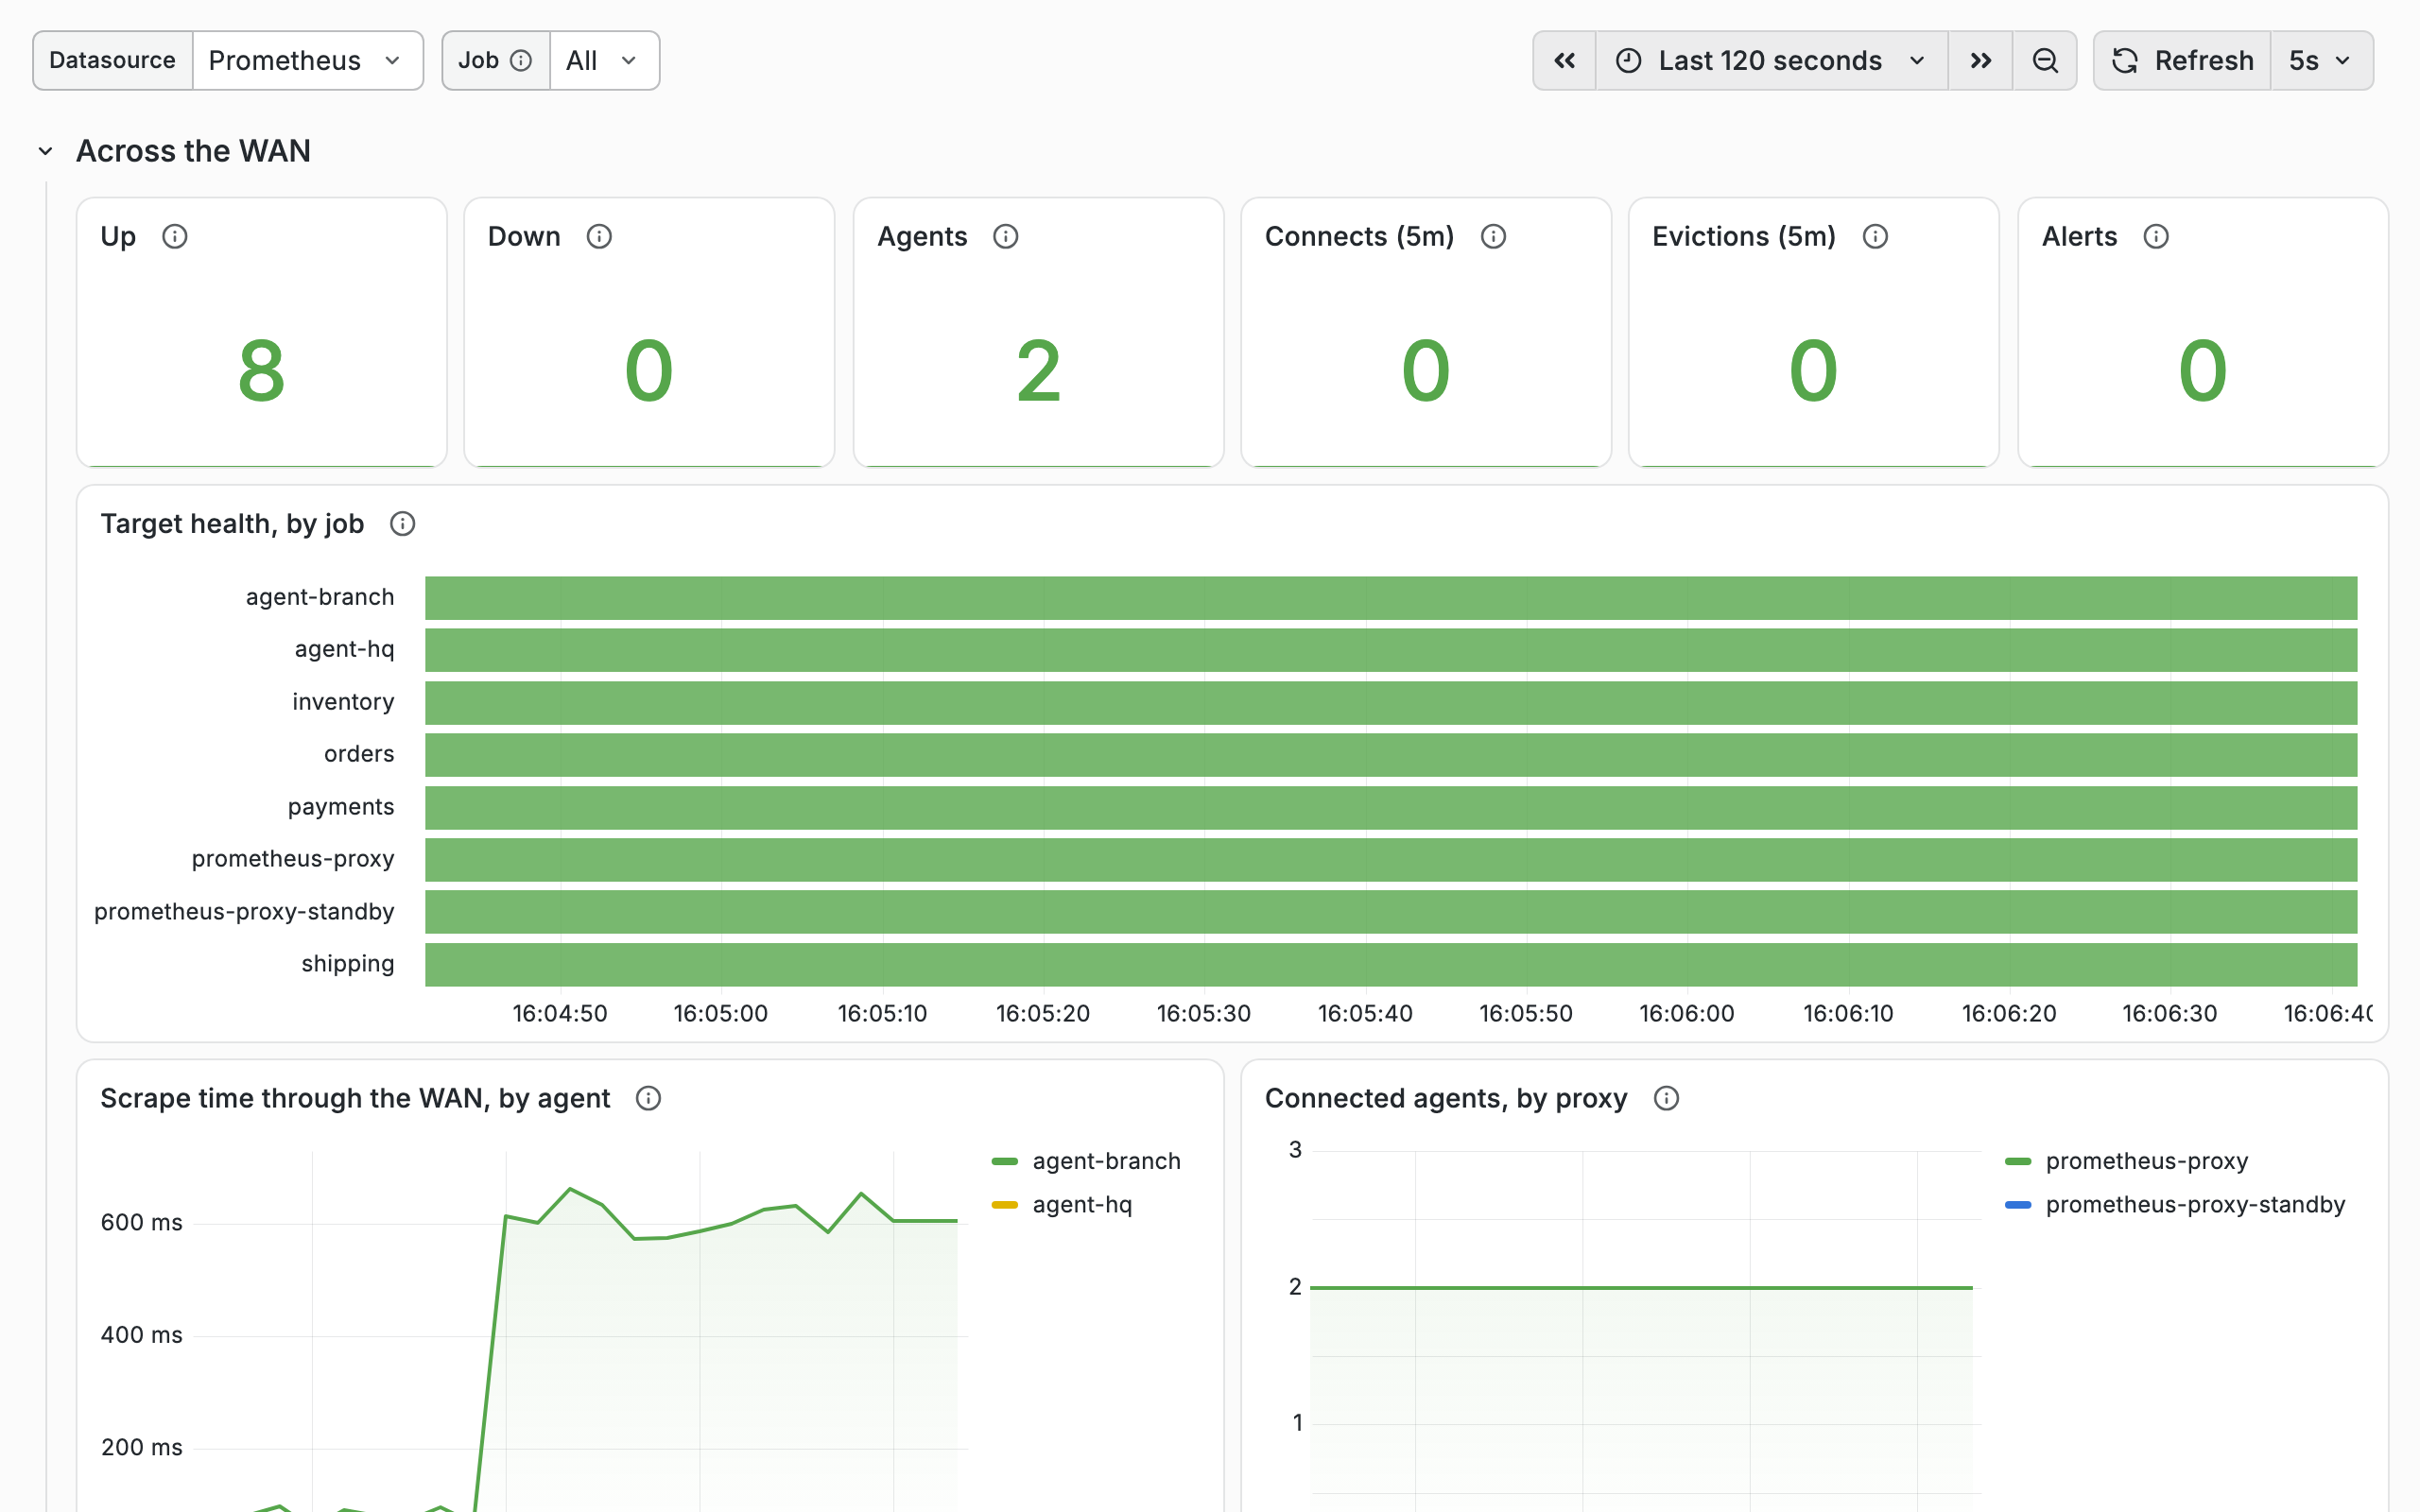
agent-branch's scrapes take about half a second, one round trip more, while agent-hq's stay well under a tenth of a second. Nothing fails: the agent's connection is already open, so a scrape needs no new handshake through the firewall, and costs the round trip and nothing more.
A low-bandwidth link fails scrapes; filtering at the agent fixes it
The inventory payload, about 56 KB gzipped, takes 7 seconds on this link, and Prometheus gives up at 4. Every path shares the link, so it backs up behind the inventory, and within about 15 seconds the shipping service and the agent's own metrics fail too. agent-hq, on its own links, is untouched.
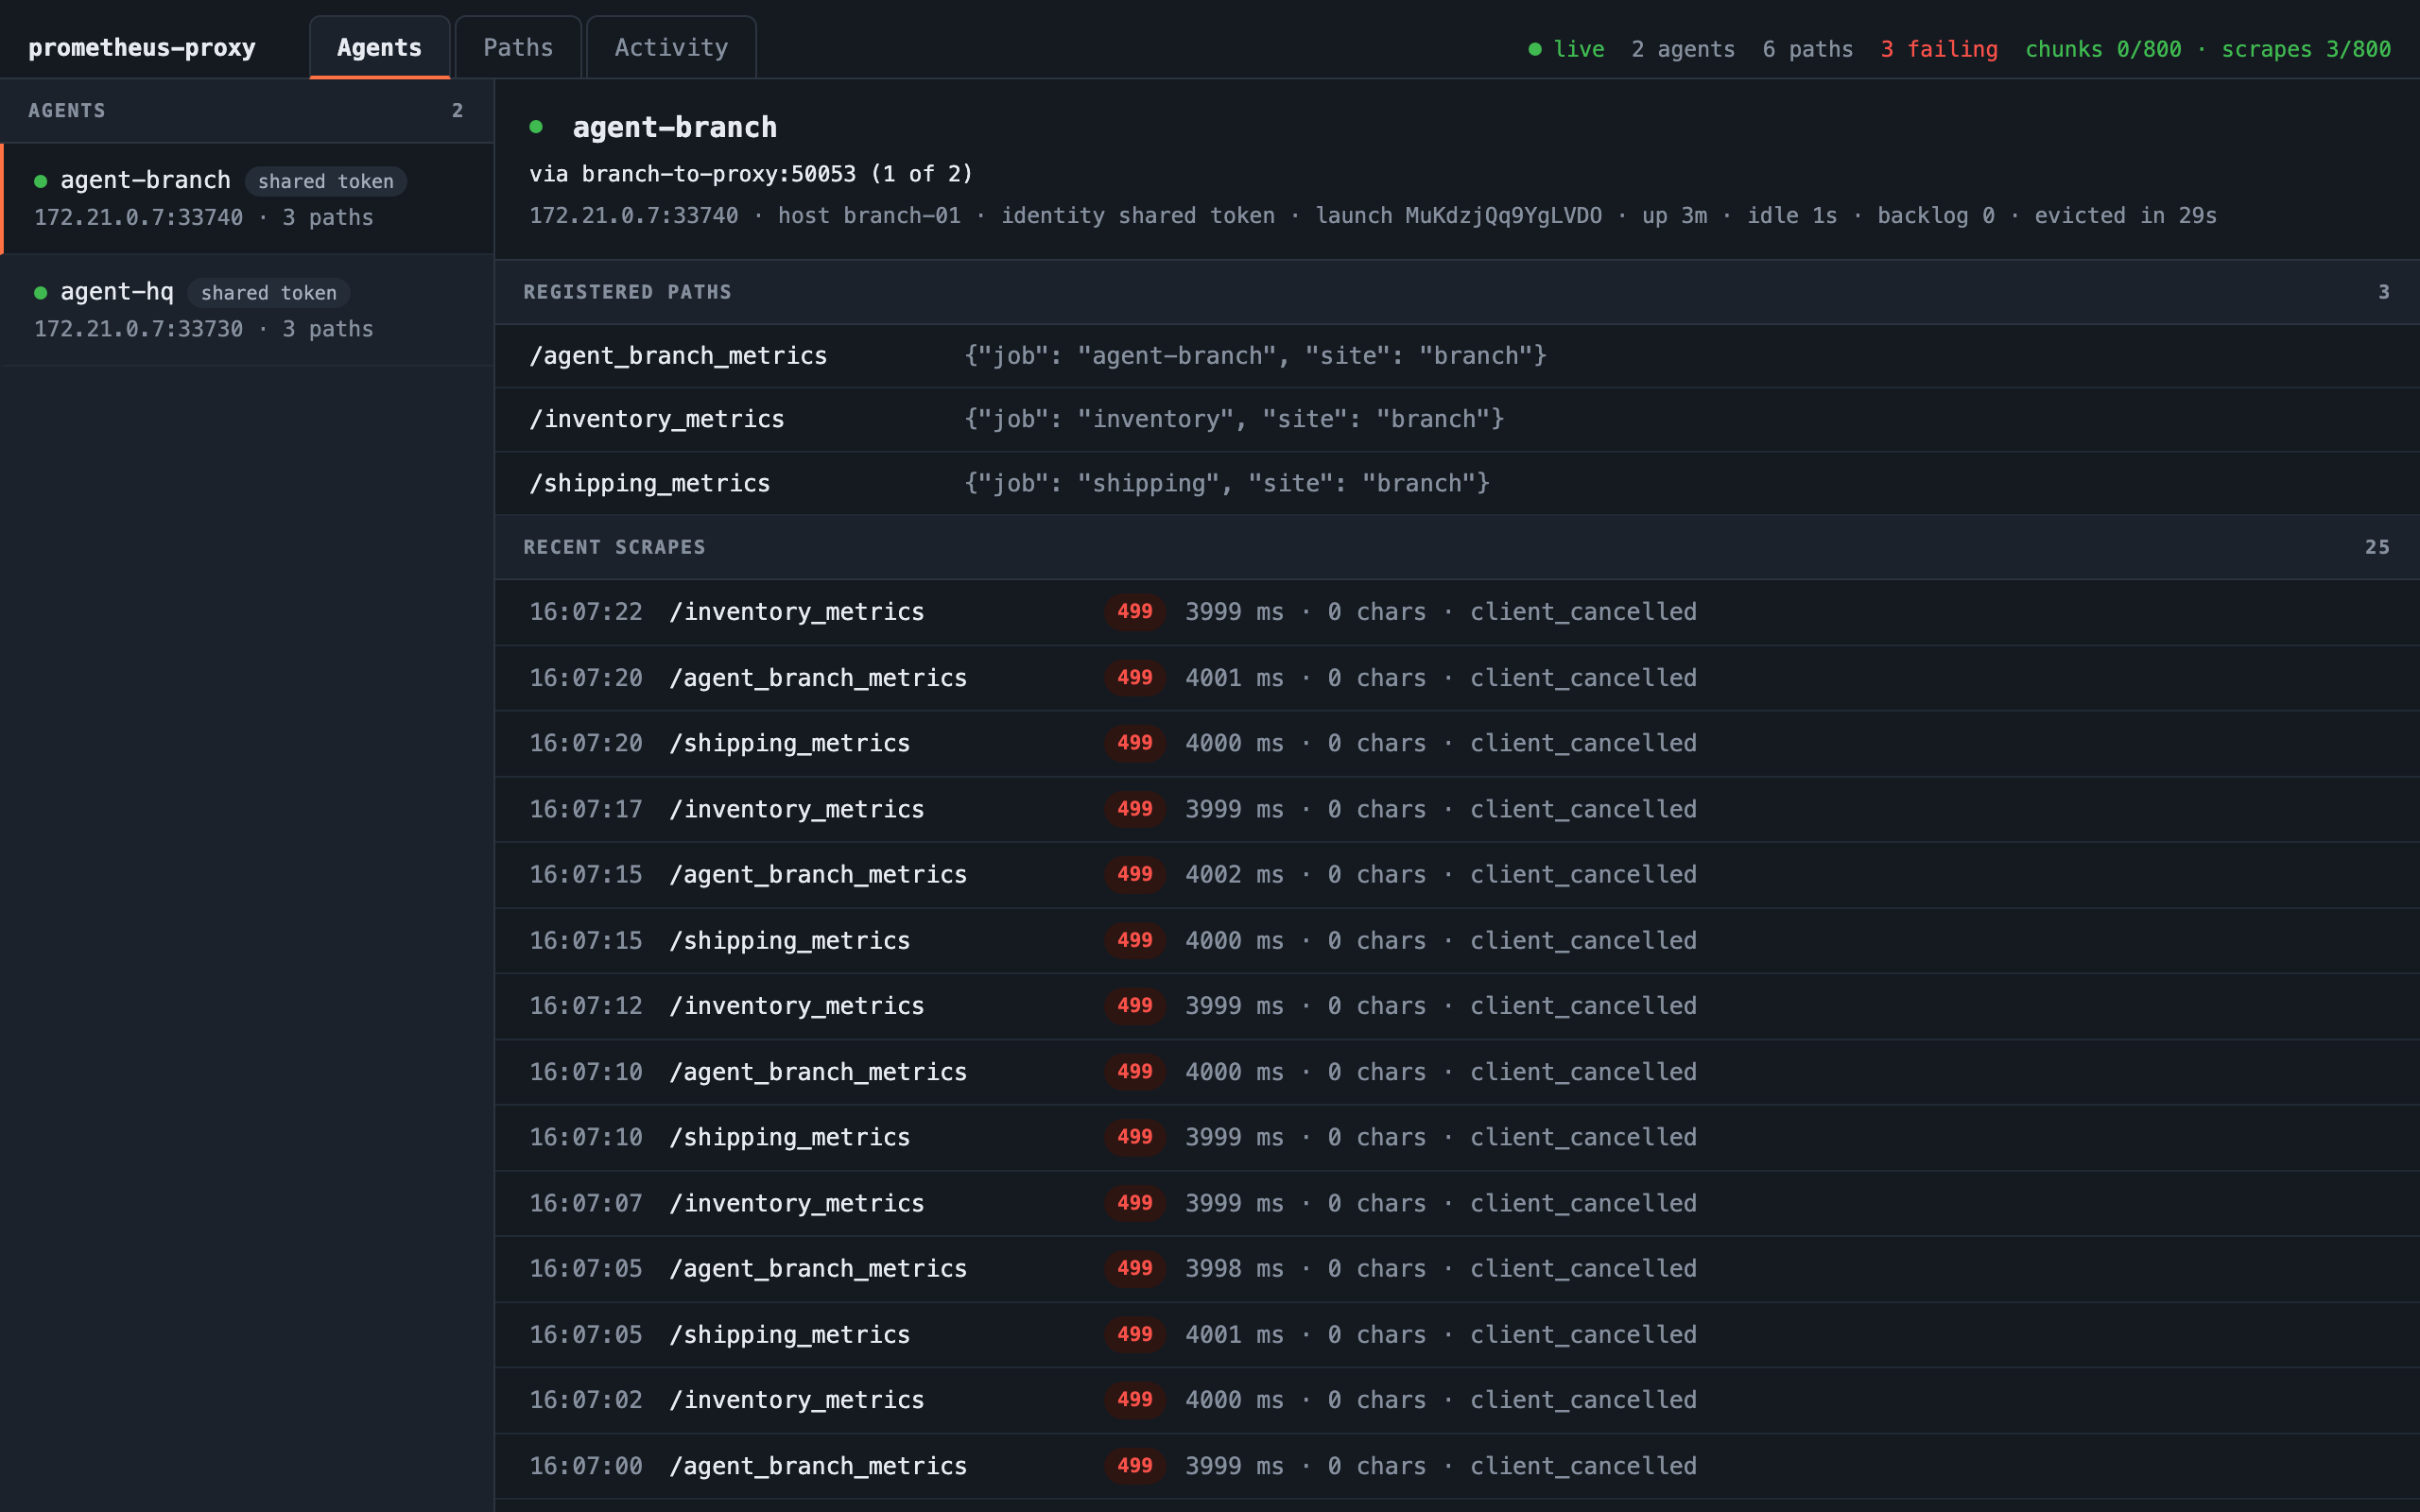
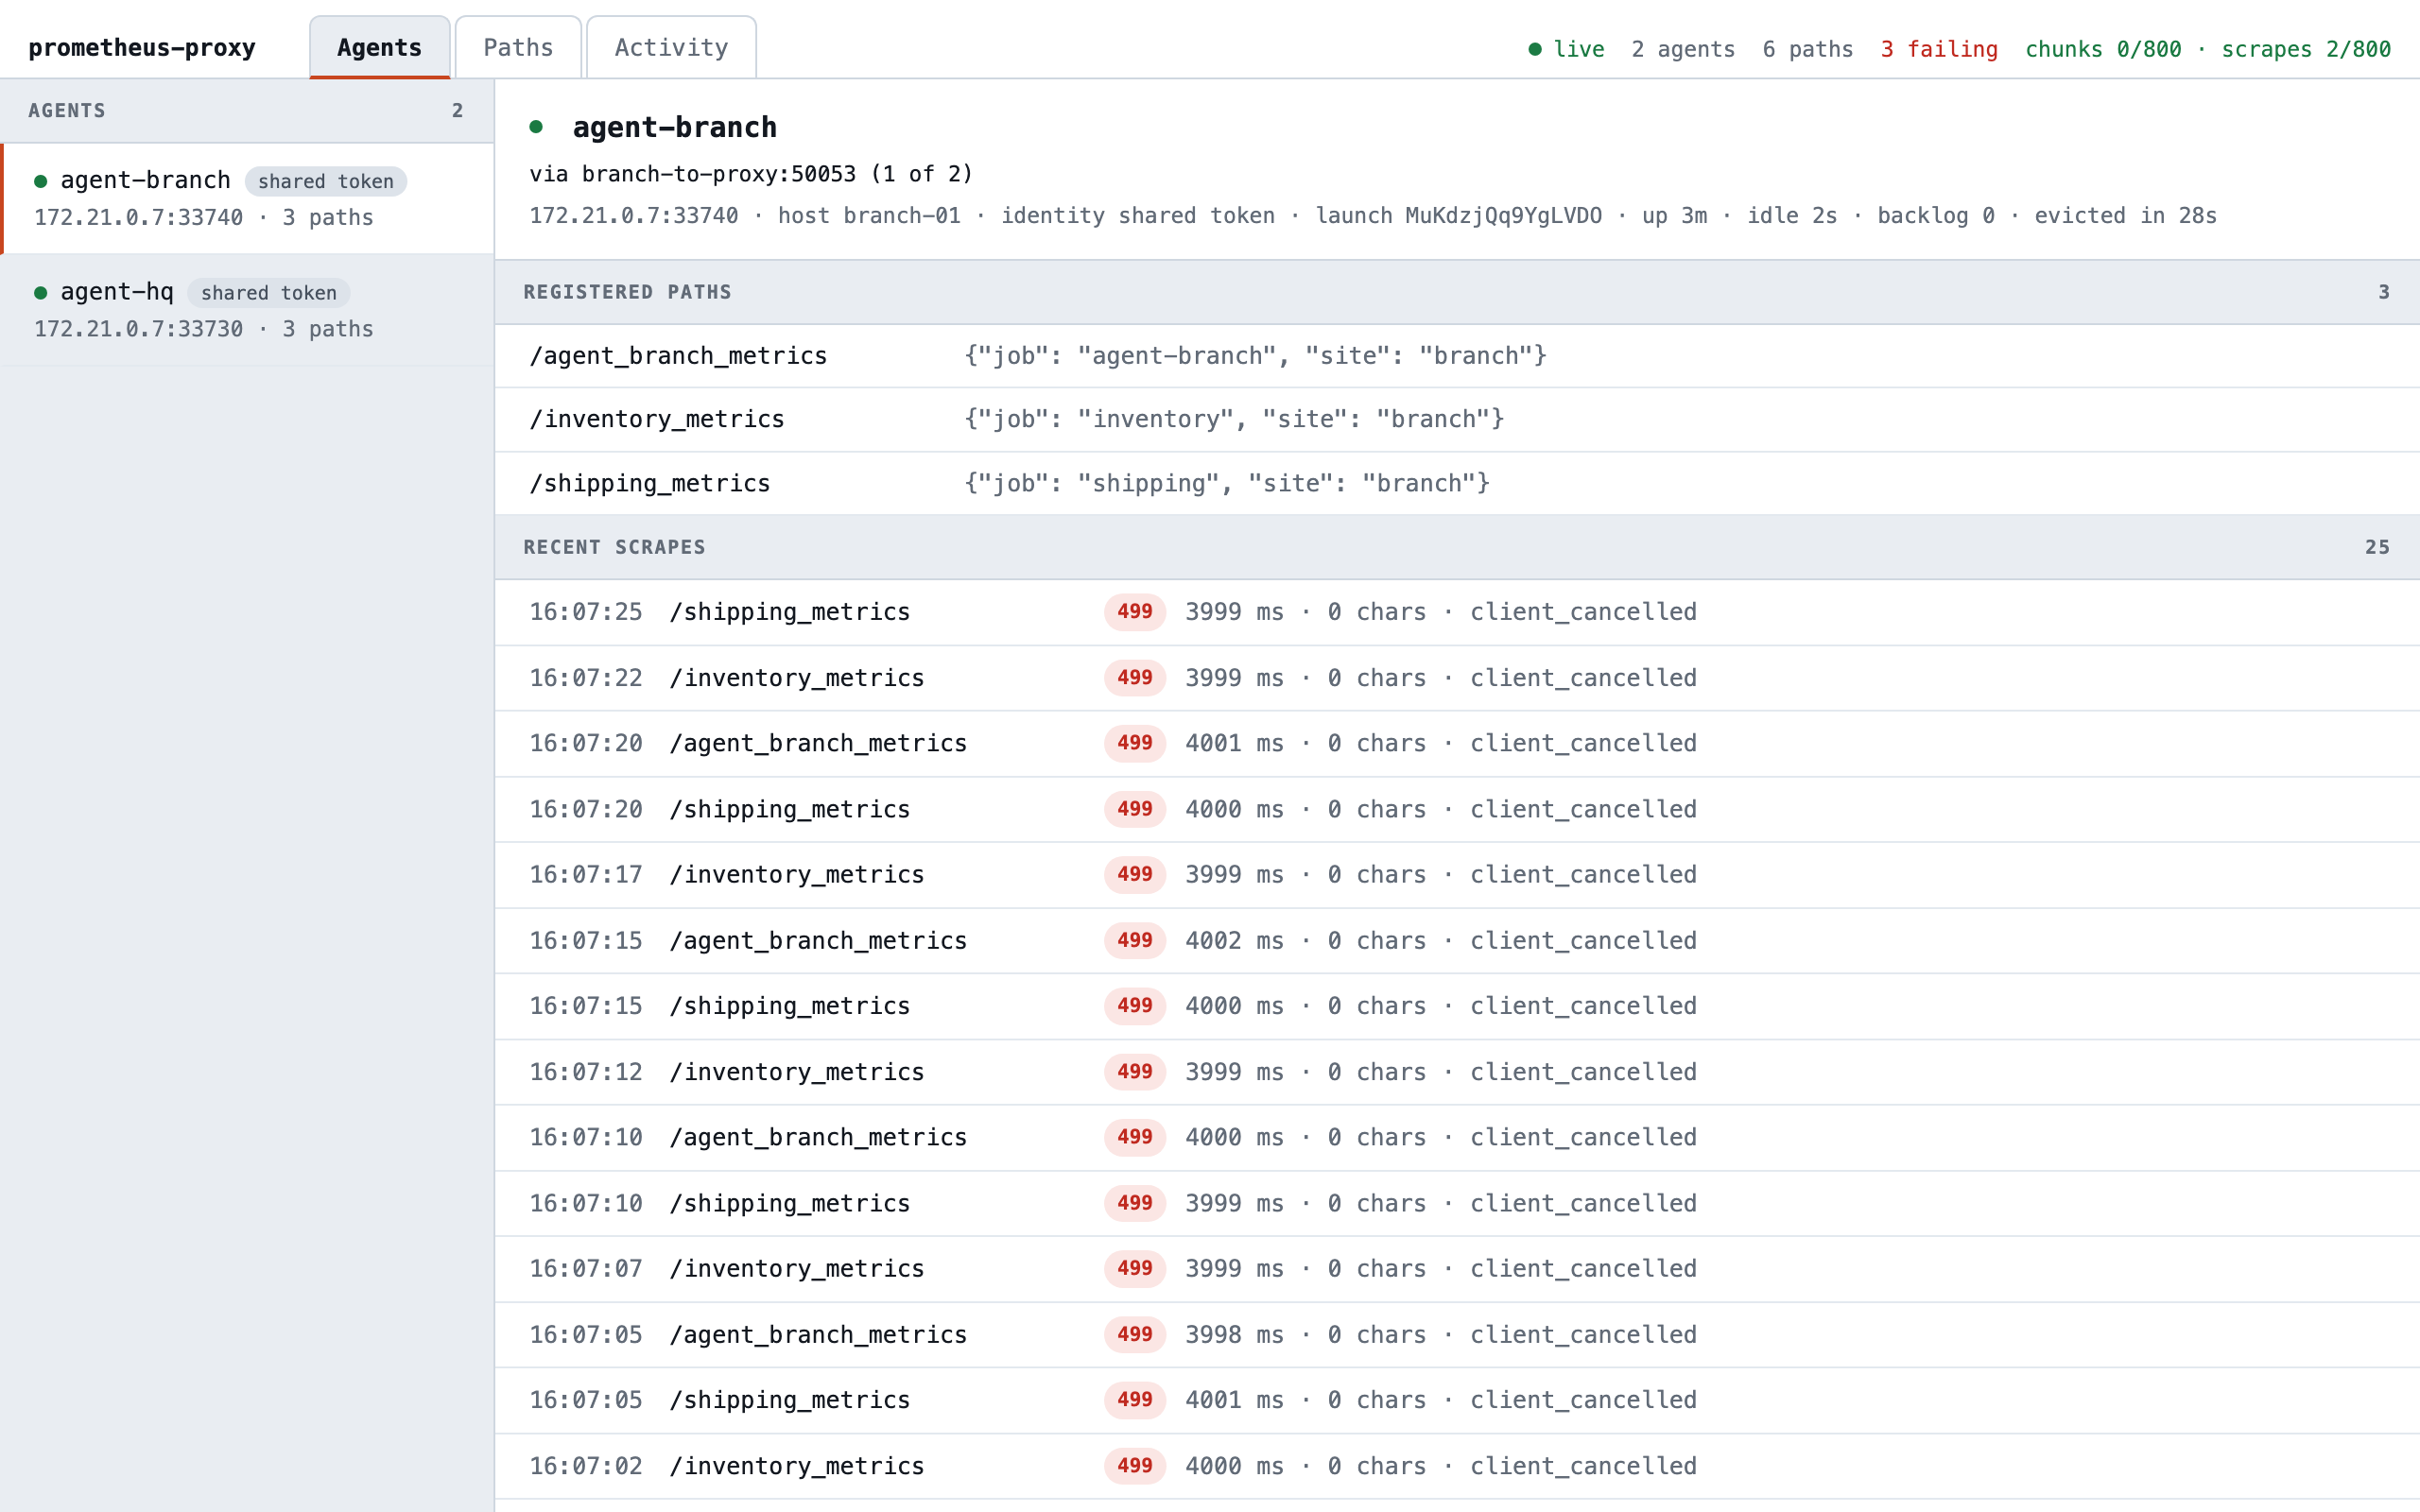
agent-branch stays connected all the while. Its answers keep arriving, too late for Prometheus, and each one tells the proxy the agent is alive, so its idle time stays near zero and the proxy never evicts it: a saturated link is slow, not dead. A link that goes silent shows one that is.
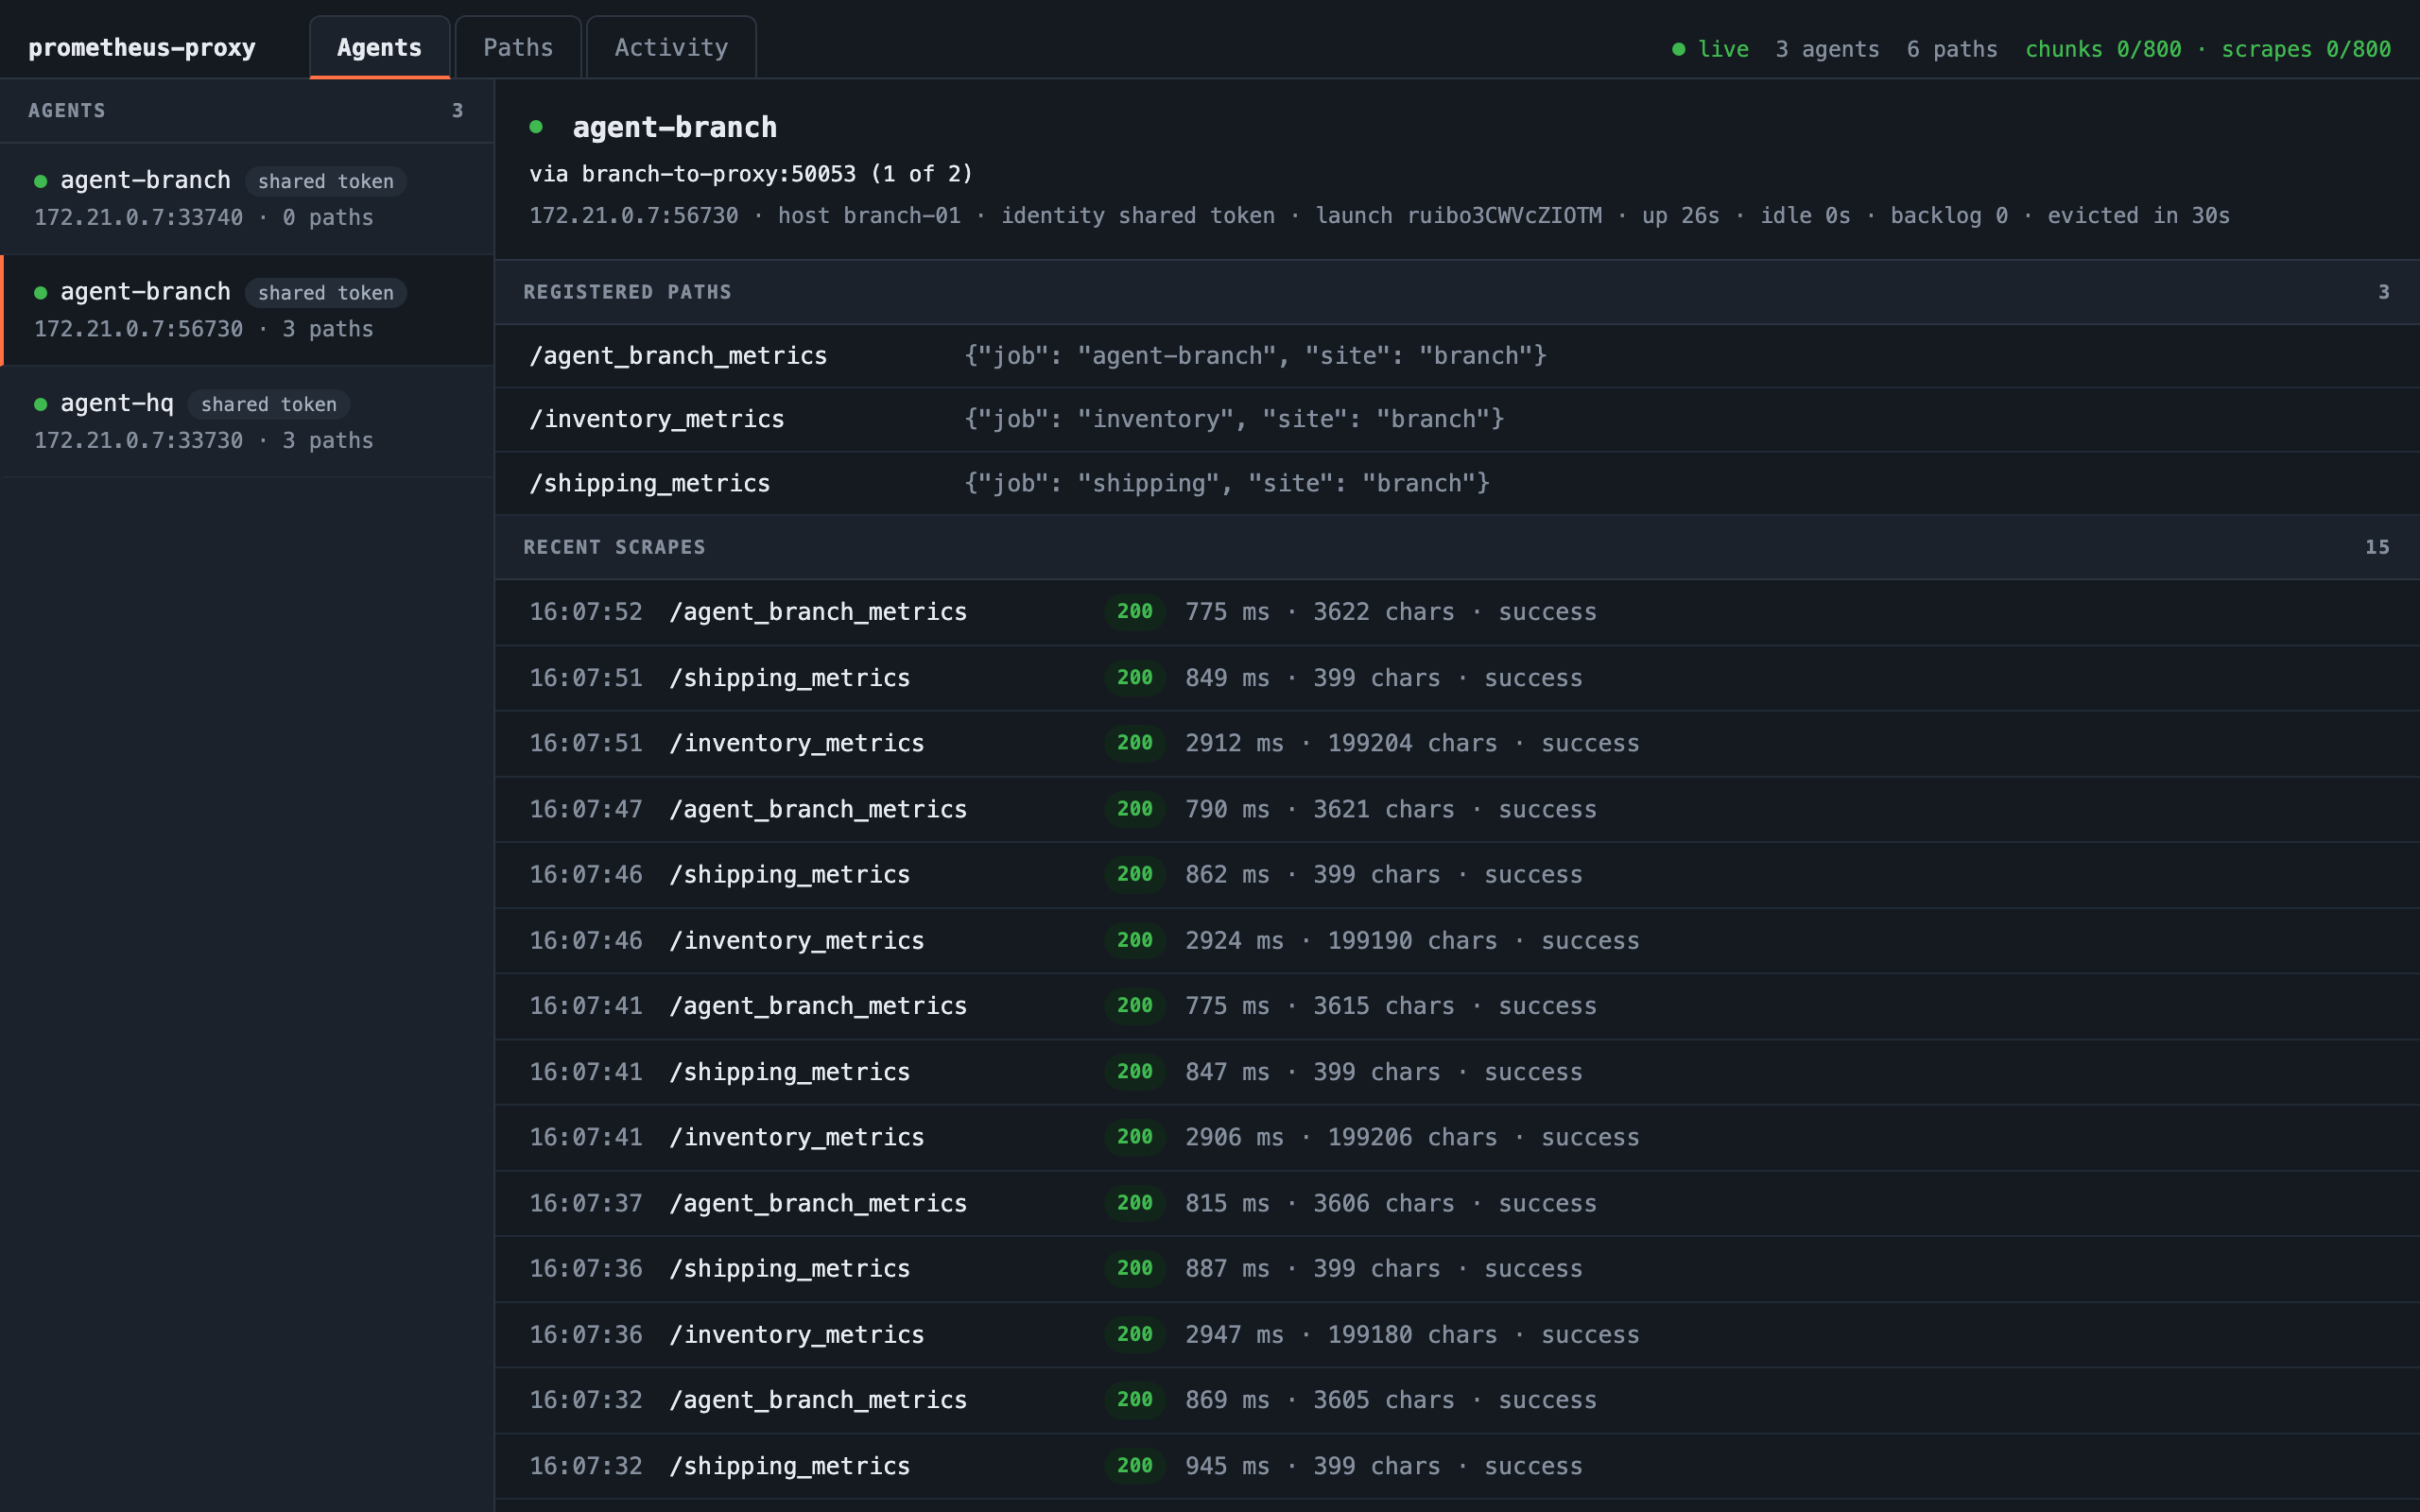
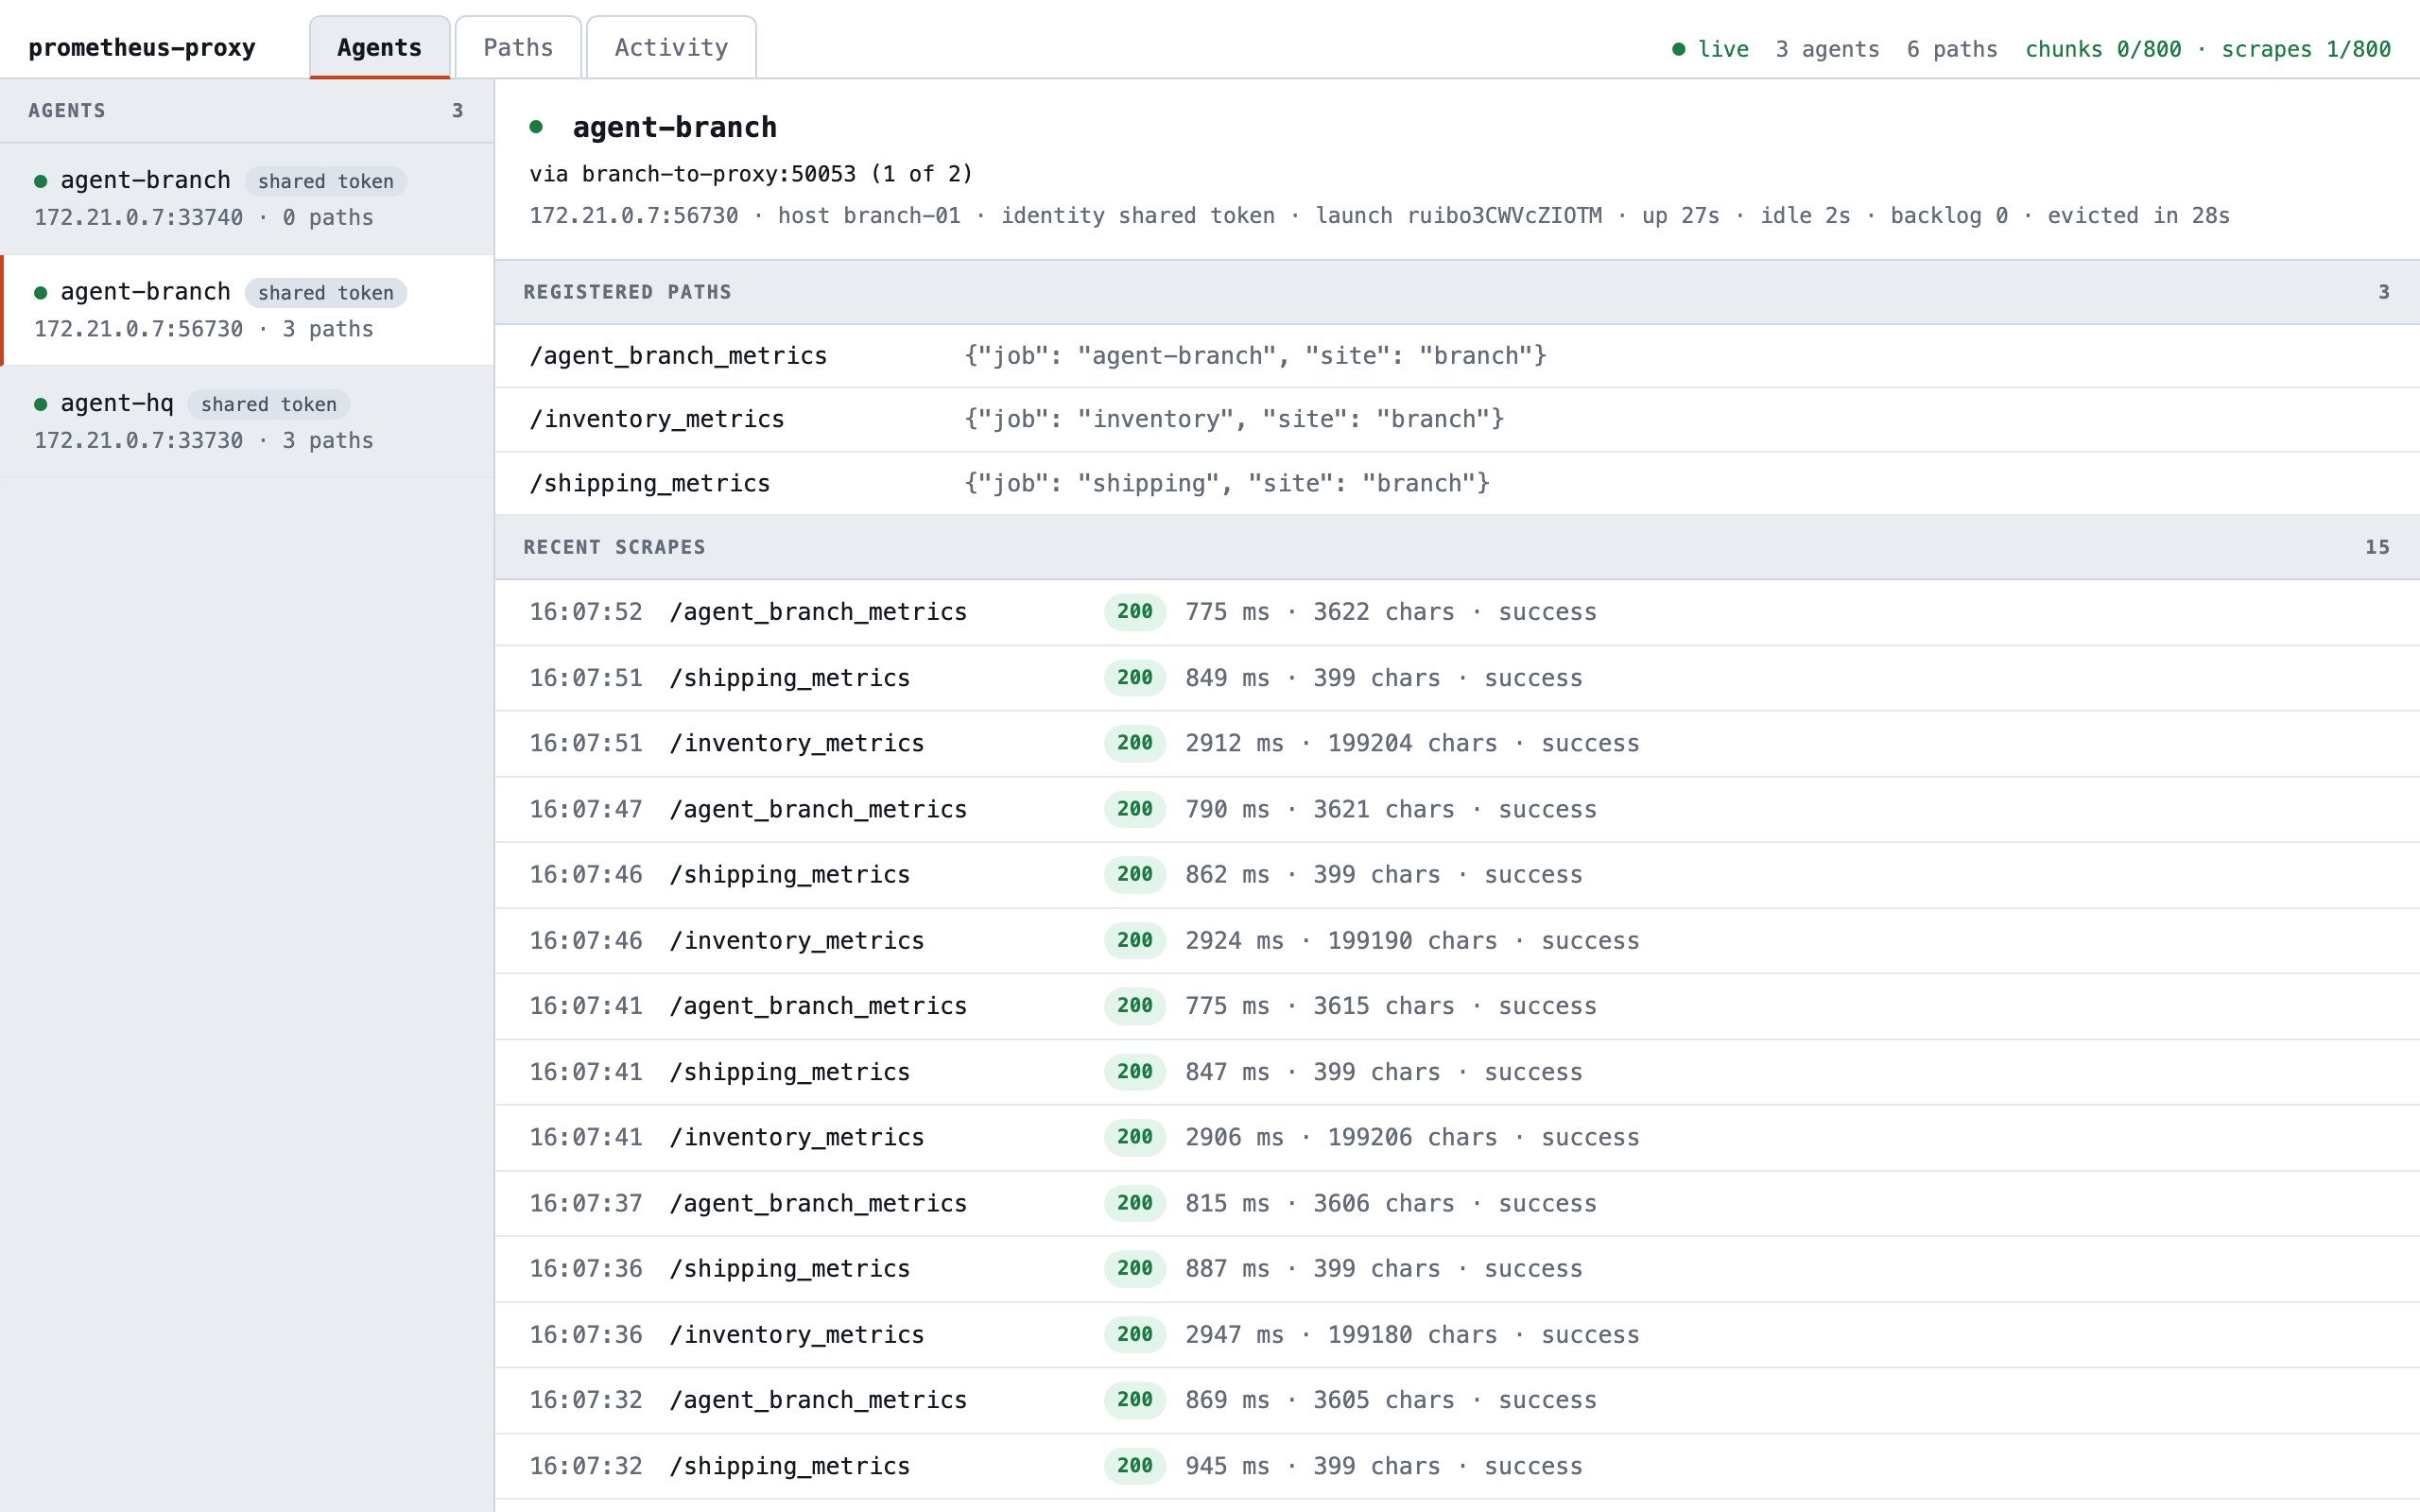
Most of the inventory's payload is a per-item price list no dashboard uses. The
filter drops that family at the agent, before the payload is compressed and
chunked, so the inventory falls from about 496,000 characters to about 199,000, 21 KB gzipped. Each scrape takes about
3 seconds on the thin link, inside Prometheus's 4, and every path is green again within about 5 seconds. Grafana's
Filter bytes saved at the agent, from agent_filter_bytes_saved_total, climbs to about 60 KB a second: what never
crosses the WAN costs nothing to send, store, or query. The restarted agent connects at once; its old connection stays
on the agent list, with no paths, for about 20 seconds more, until what it had queued drains through the thin link.
./demo.sh heal and then ./demo.sh unfilter restore the link and the full payload. heal alone, without the filter,
brings every path back within a second or two, since what the thin link had queued drains at full speed.
The primary proxy stops, and the agents fail over to the standby
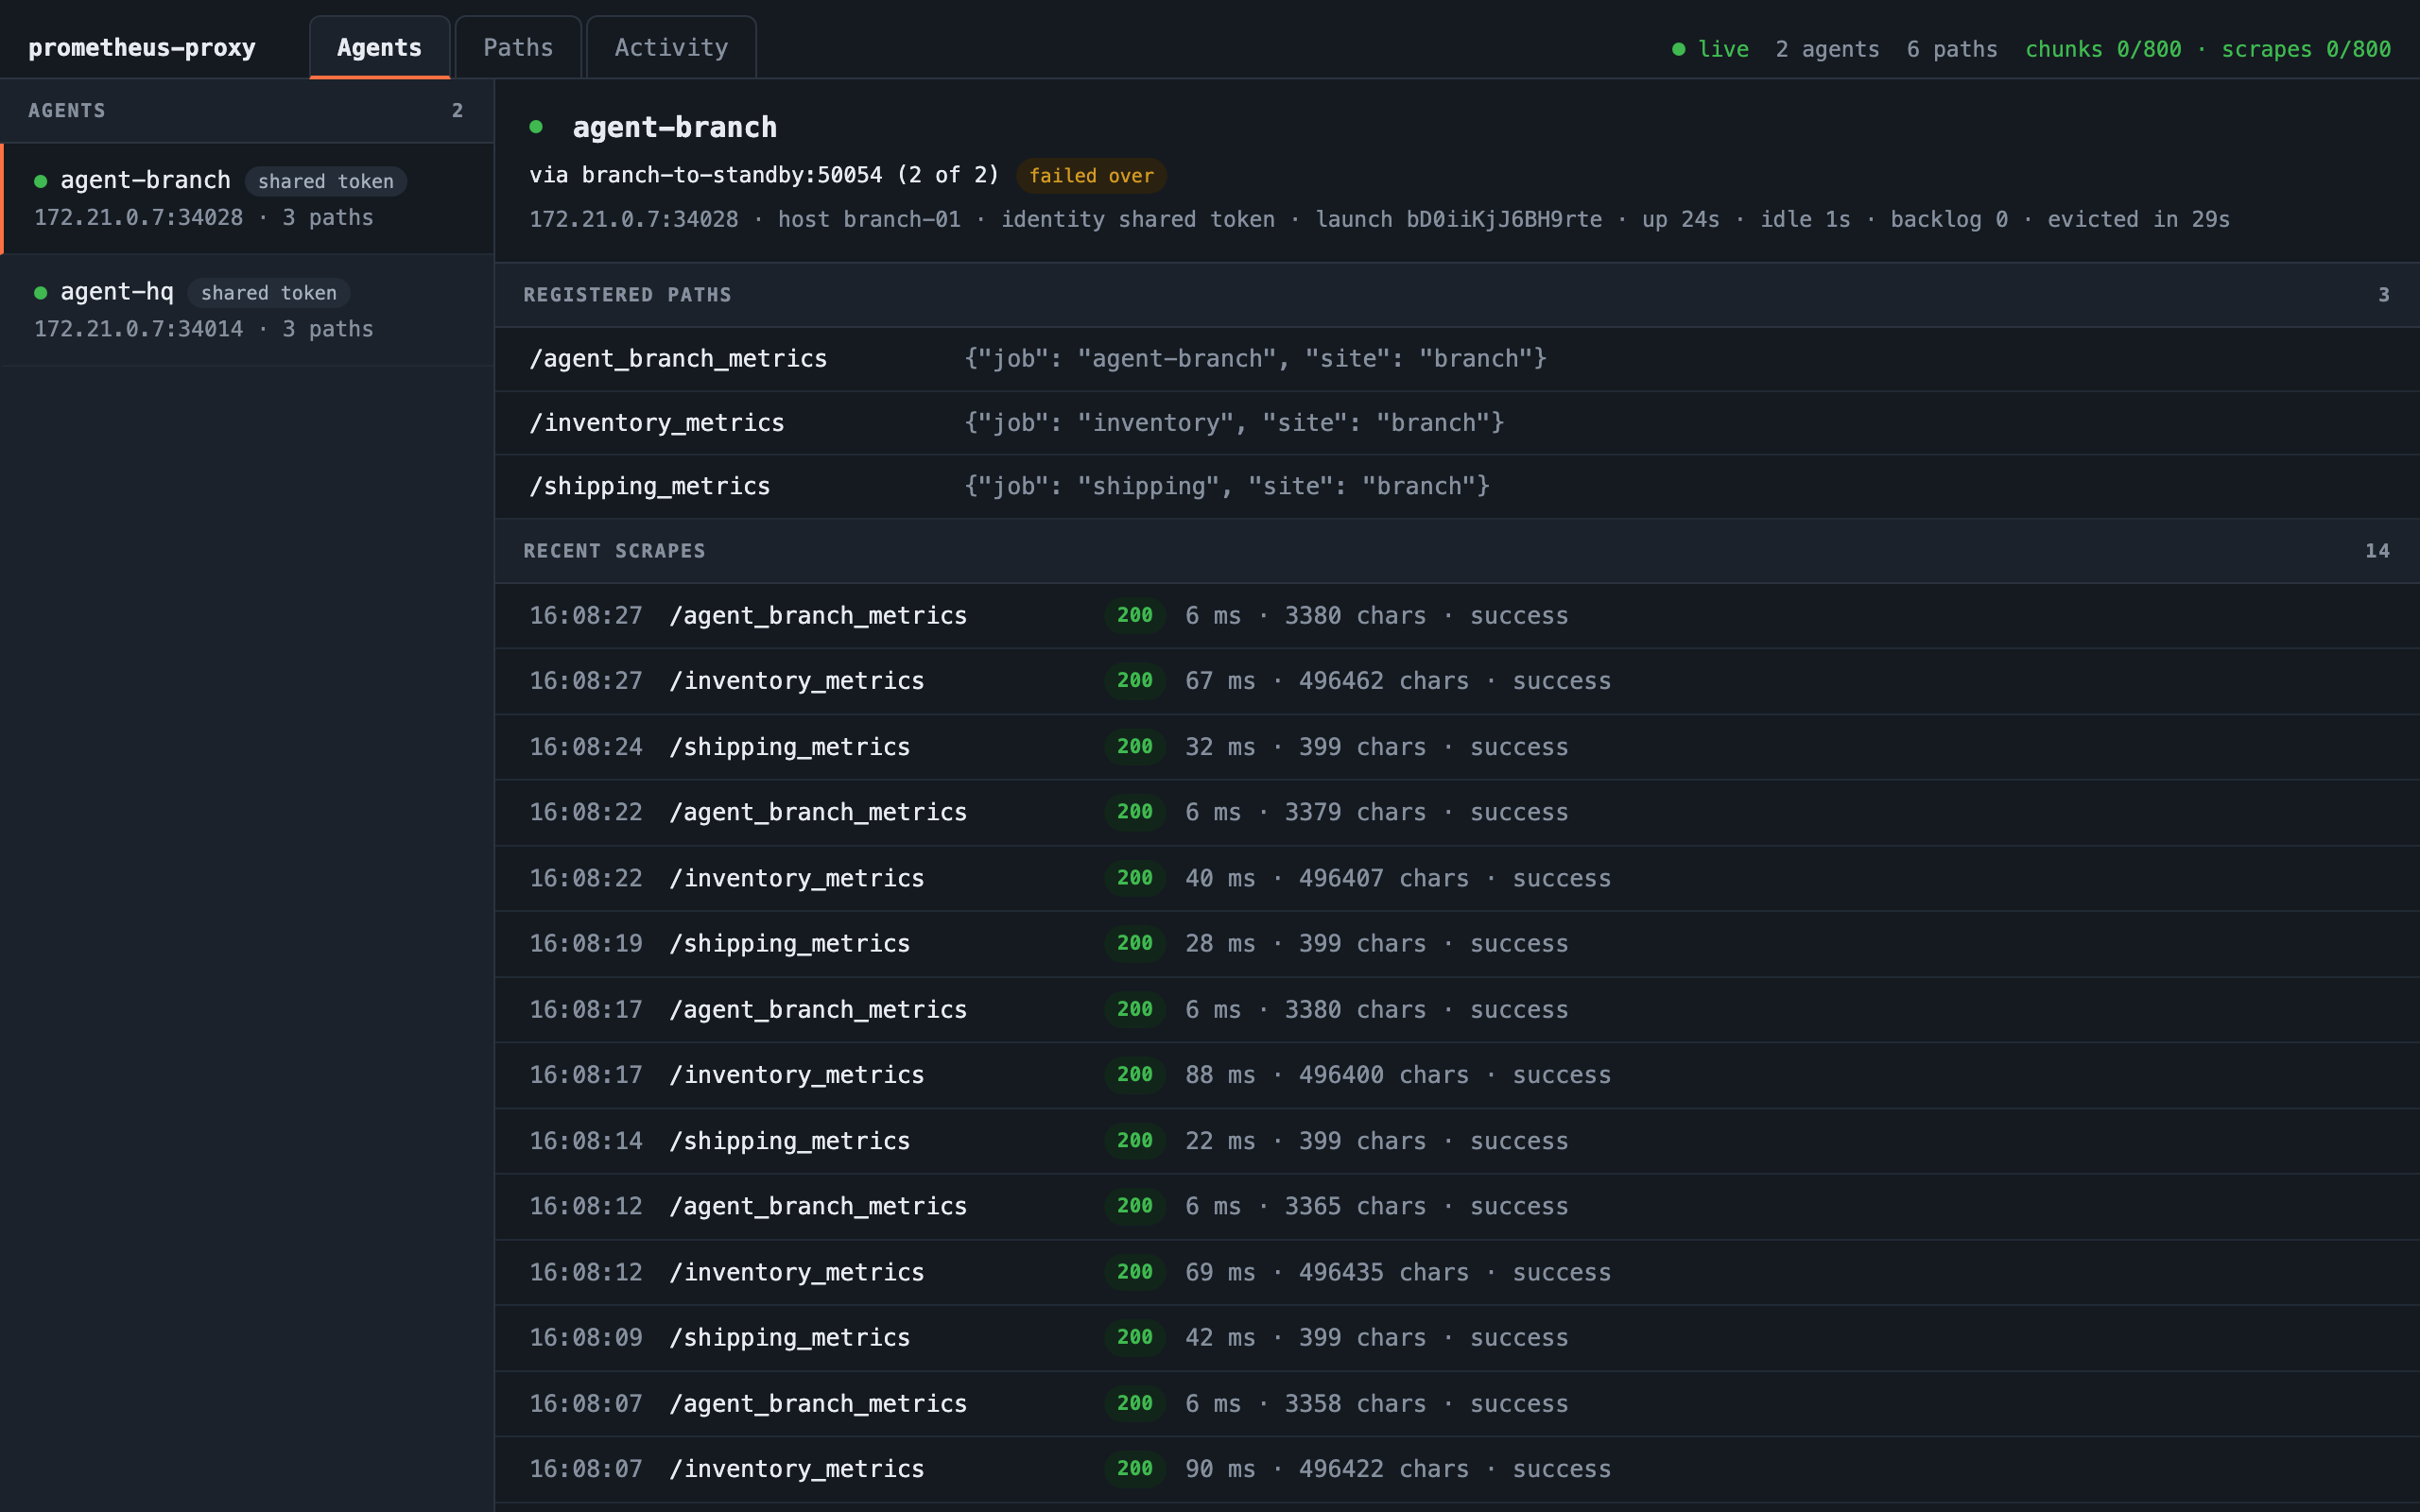
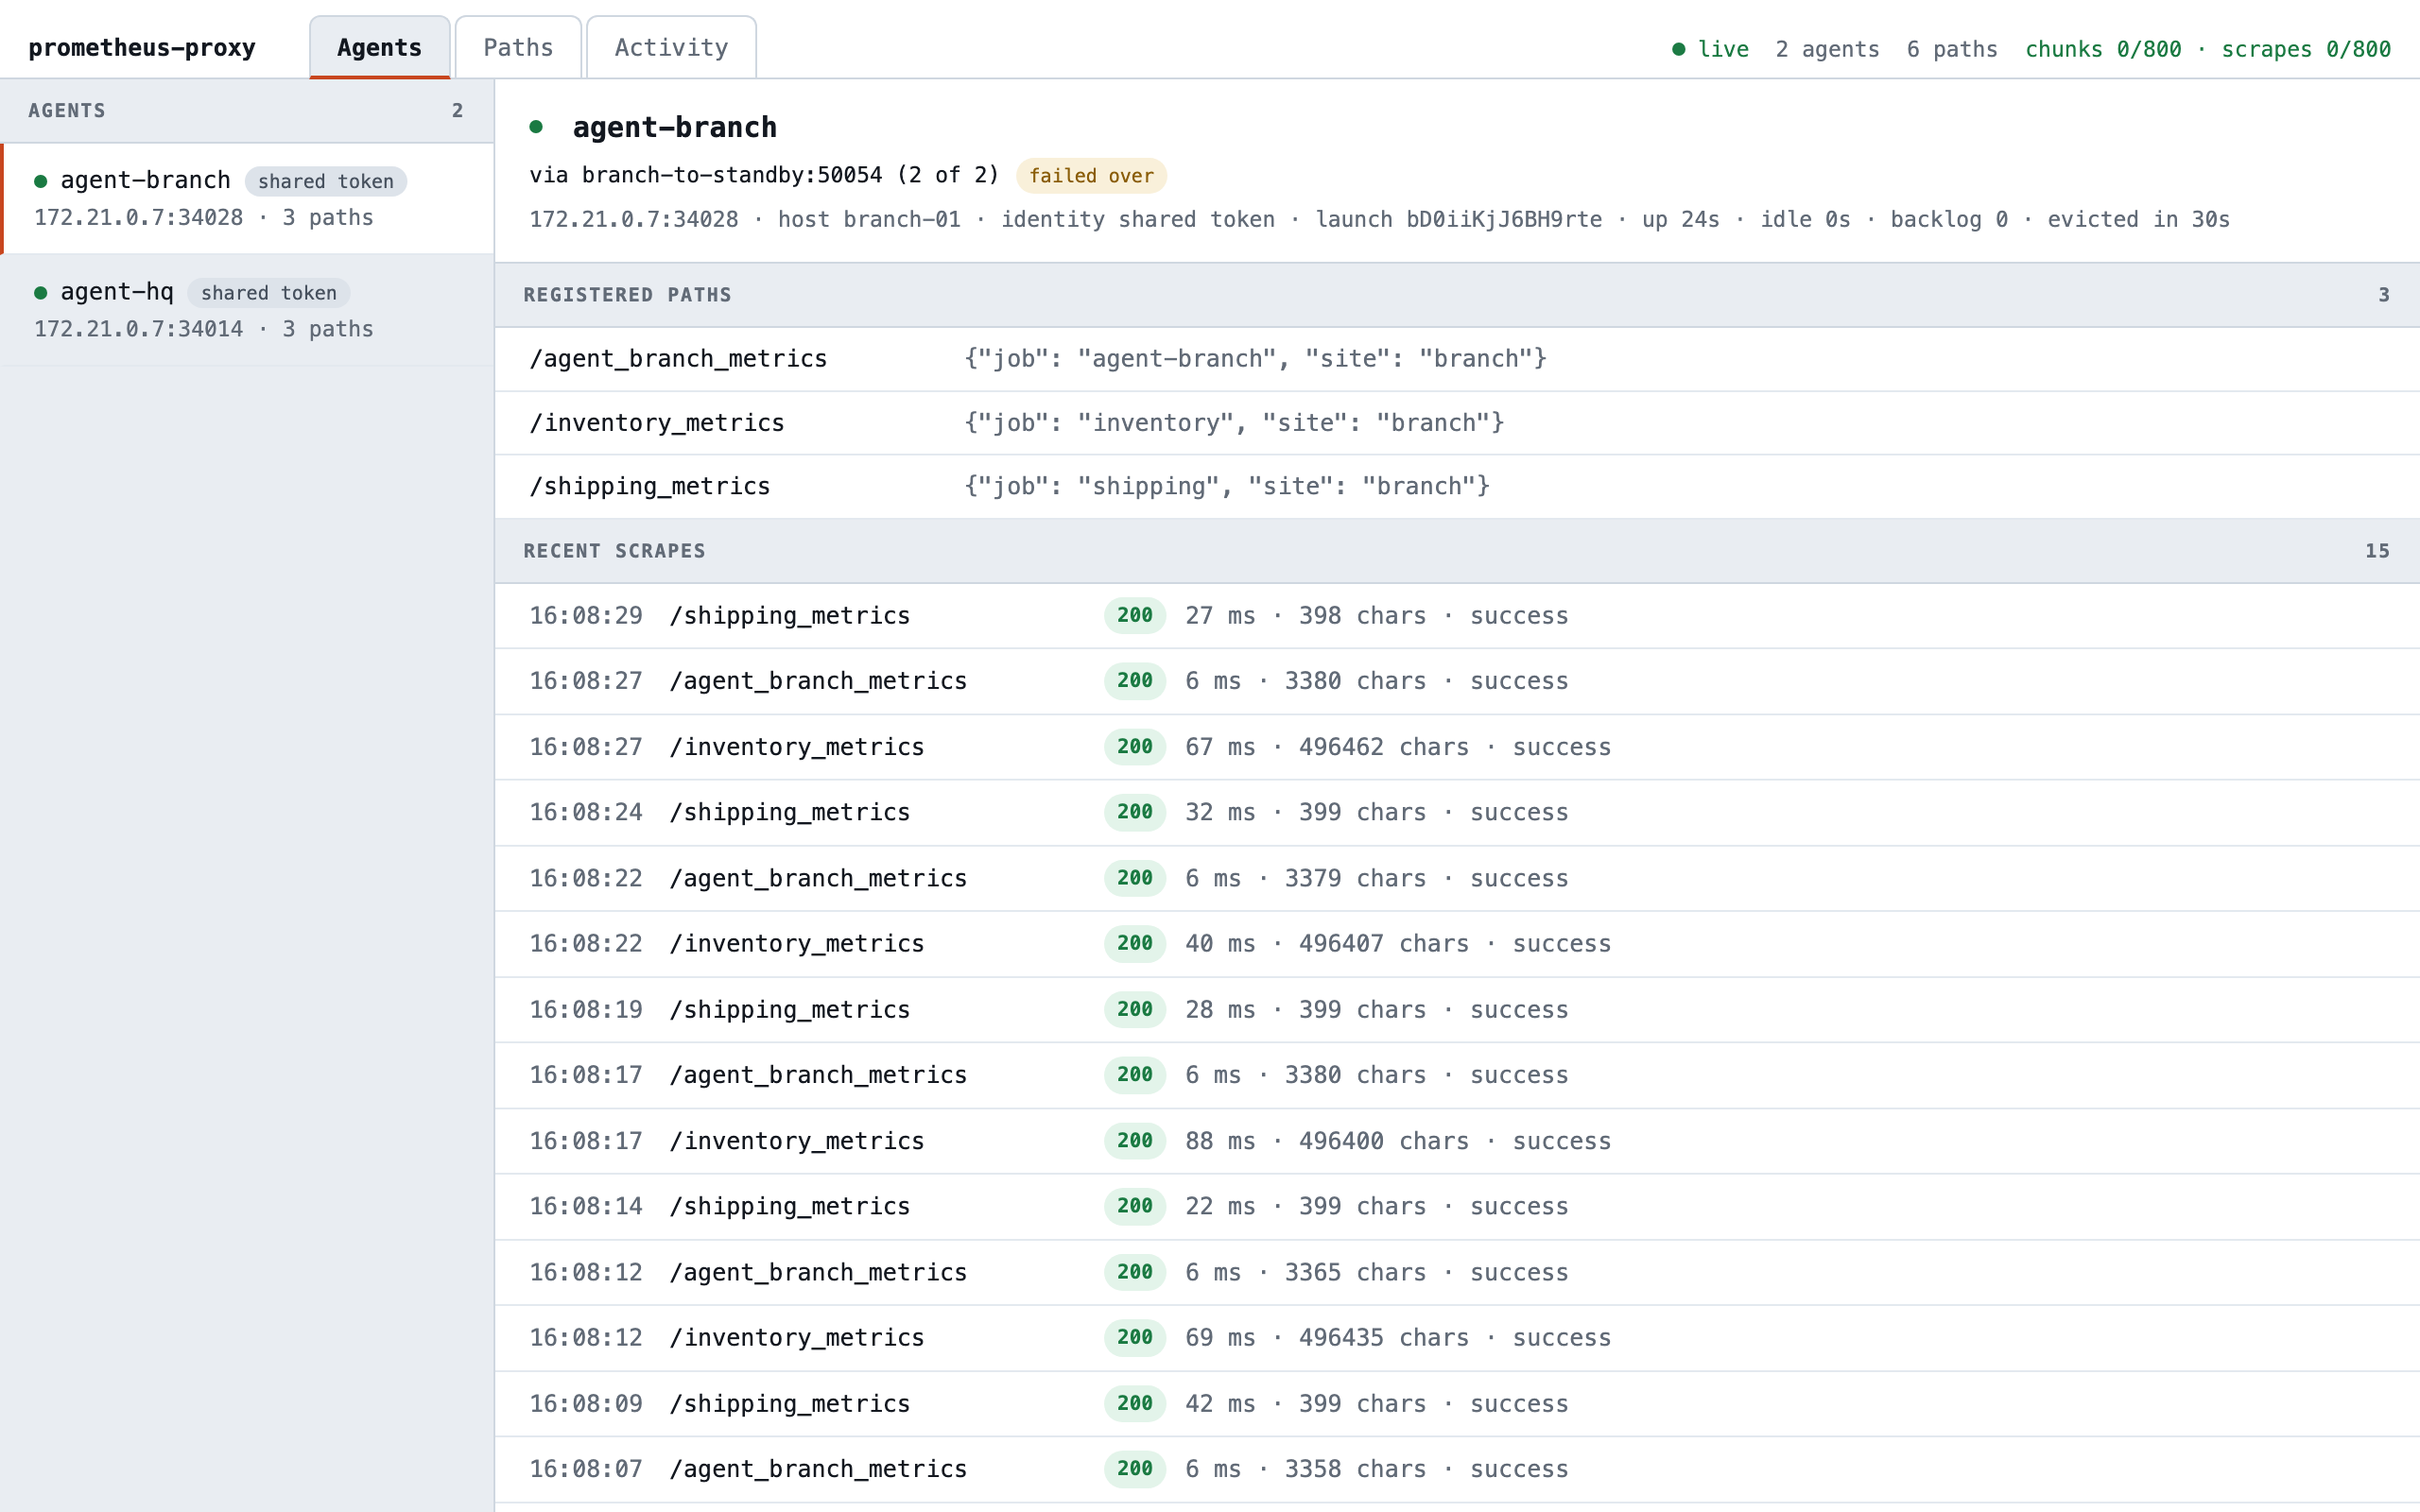
The primary's connections close, so both agents know at once, and within about 4 seconds they're on the standby, with
no manual step: its dashboard shows each one via its link to the standby, (2 of 2), marked failed over, from
the agent's ordered endpoints. Prometheus discovers through both proxies, so
within about 15 seconds every service is up again in Grafana, scraped through the standby; only prometheus-proxy, the
primary's own metrics, stays down, and NetworkTargetDown fires for it alone.
./demo.sh proxy-up brings the primary back, but the agents stay on the standby: an agent returns to the head of its
list only when its connection drops. ./demo.sh heal closes each agent's connection through its standby link once,
and they return to the primary within seconds.
A link goes silent; the agent detects it and fails over
Here the connection doesn't close. The link stops passing anything, the agent's own goodbye included, which is what a stateful firewall or NAT that drops a connection does, and nothing tells either end.
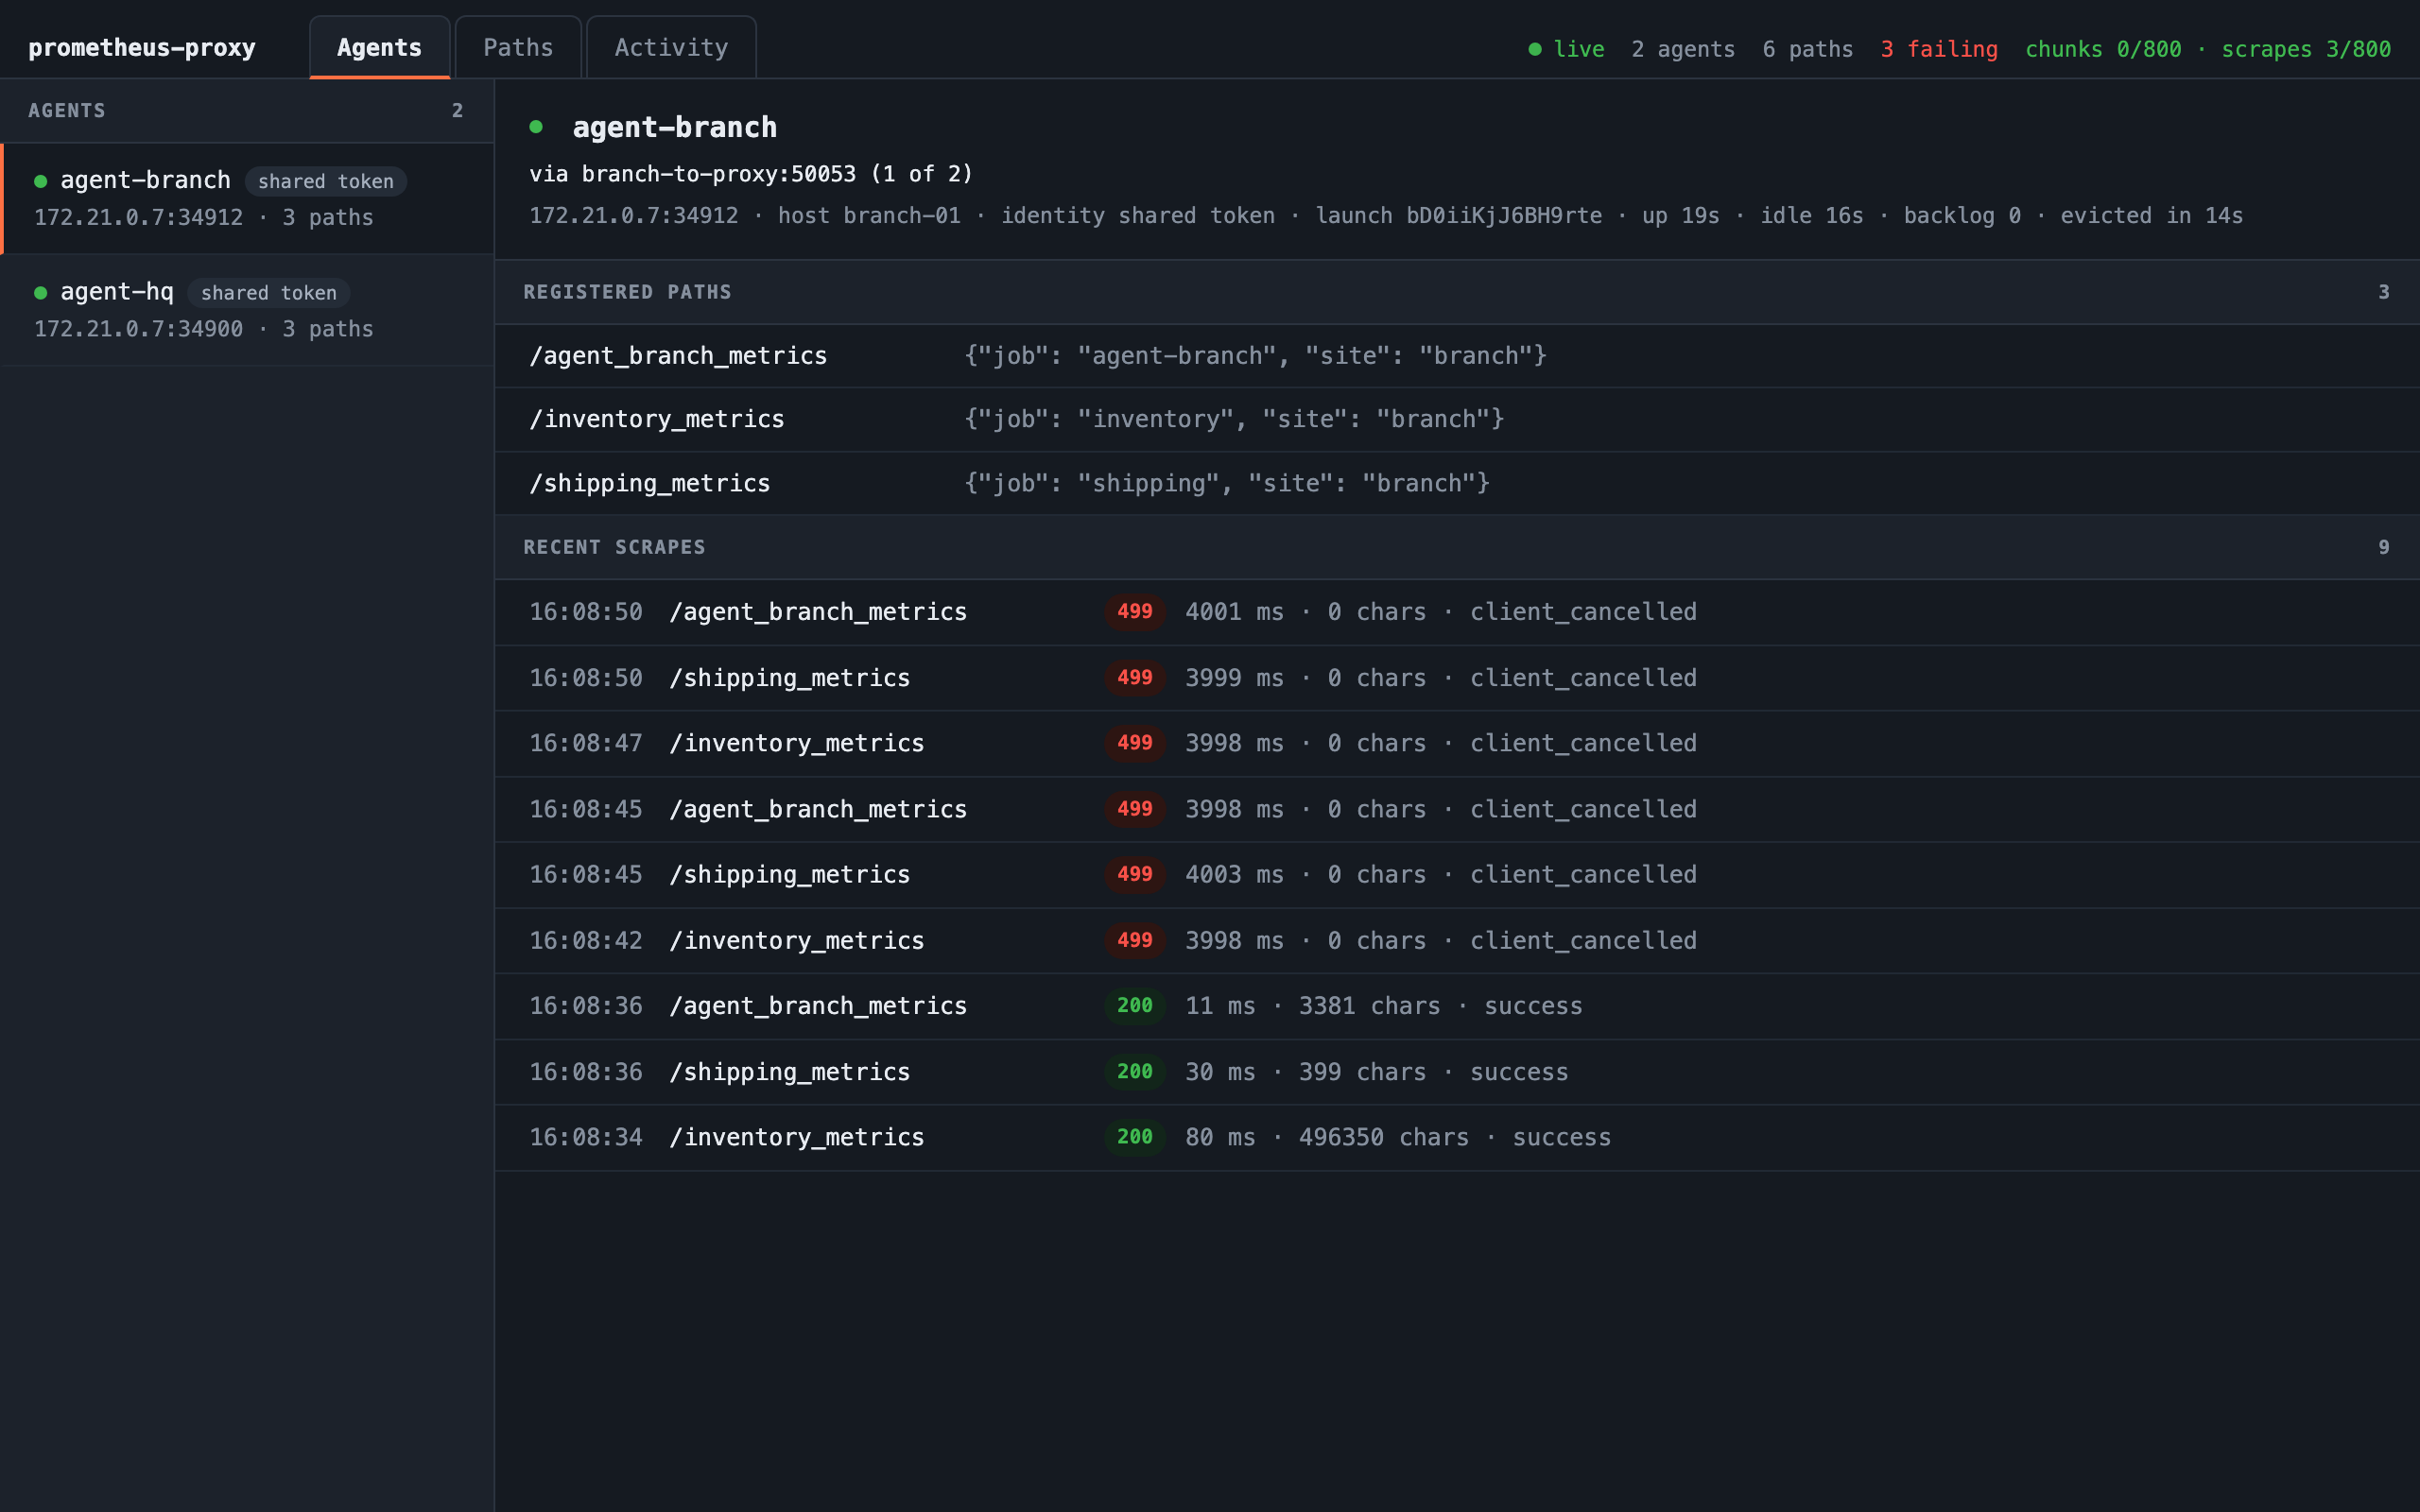
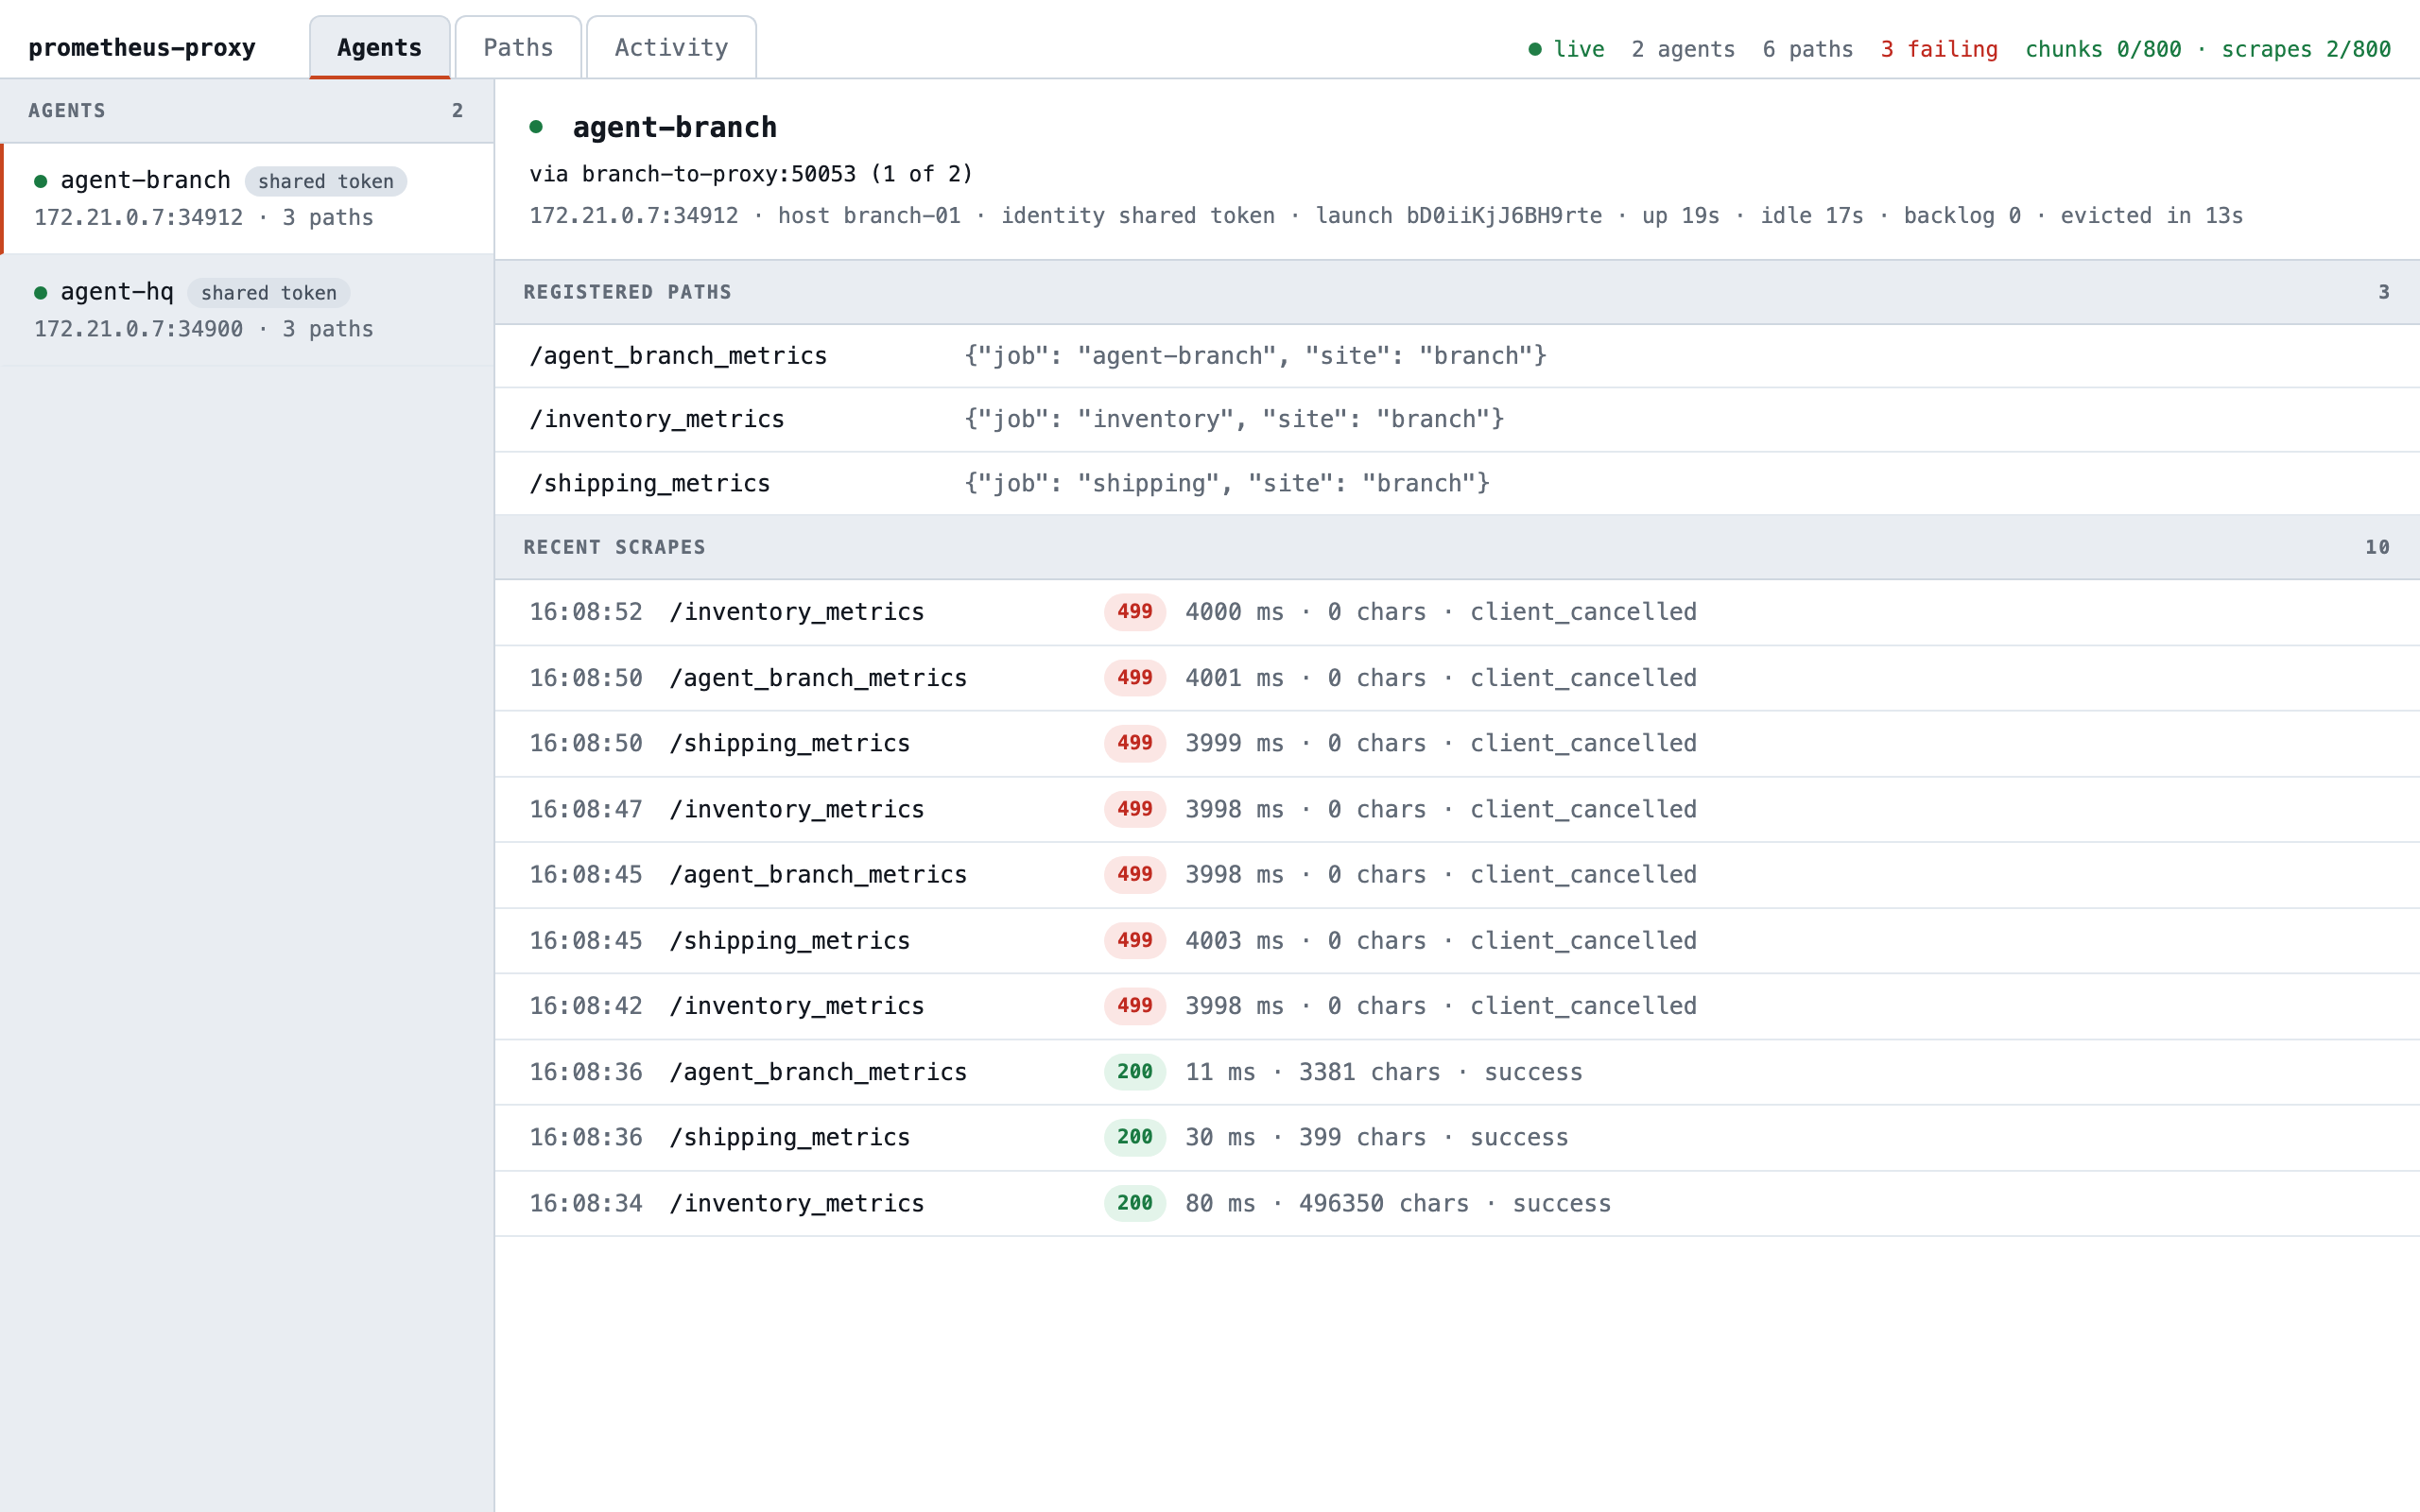
Within about 10 seconds agent-branch's scrapes time out. Its heartbeat fails three times, with a 5-second deadline
each, so at about 20 seconds the agent gives up on the connection and dials the head of its list again: the same dead
link, where the connect waits out its 30-second deadline (agent.grpc.unaryDeadlineSecs). Meanwhile the primary,
which has heard nothing, evicts the agent after 30 seconds of silence (proxy.internal.maxAgentInactivitySecs, which
the demo sets to 30), and NetworkAgentEvicted fires. At about 50 seconds agent-branch connects through its link to
the standby, failed over, while the primary is still up. agent-hq is untouched throughout.
A link that keeps dropping: the agent reconnects, traced in Zipkin
The link closes each connection once it has carried 170 KB toward the proxy, about 15 seconds of agent-branch's
traffic. Each time, the agent reconnects within milliseconds and stays on the primary, since a connection that
registered and then dropped retries from the head of the list. Grafana's Agent connects, by agent, from
agent_connect_count_total, climbs, and most scrapes succeed; the one in flight as a connection drops fails as
agent_disconnected.
Every proxy and agent reports a Zipkin span for each gRPC call between them, under its
own service name. In Zipkin, the search is serviceName = agent-branch. Open
http://localhost:9511/zipkin/?serviceName=agent-branch, which fills that search in, and click Run Query.
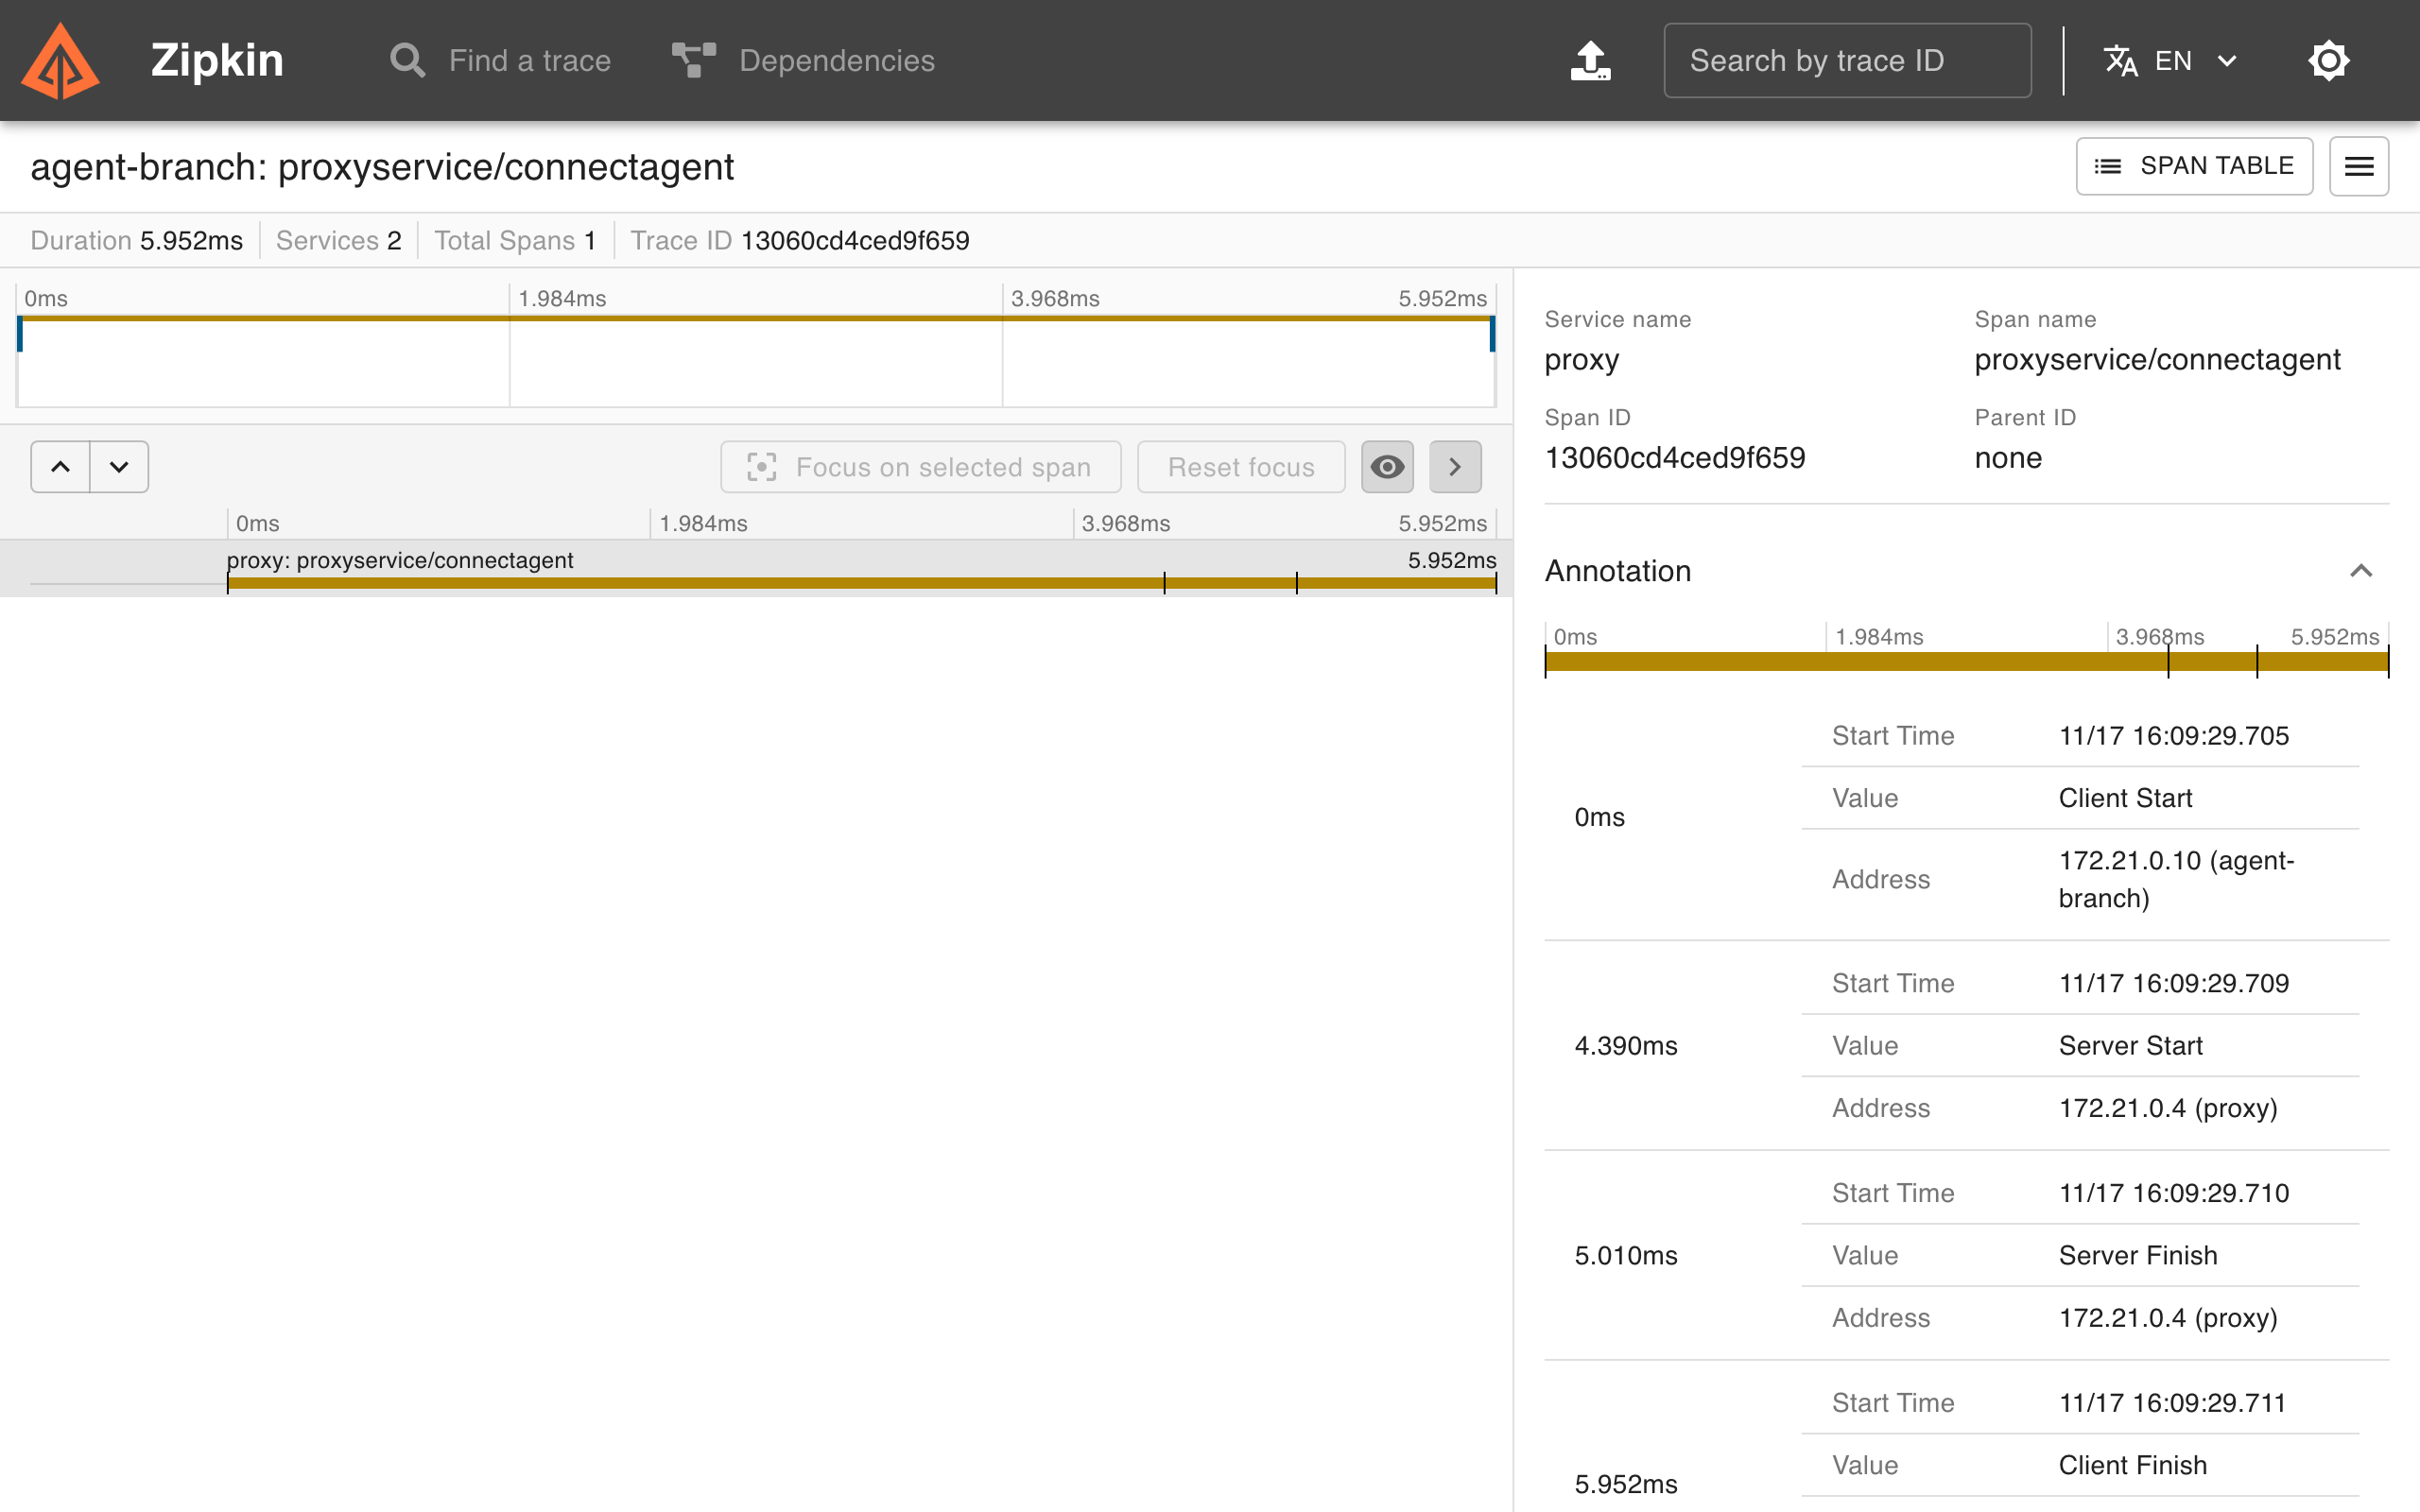
Each reconnect is a connectagent trace, then registeragent and a registerpath for each path. Zipkin joins the
agent's client side and the proxy's server side of each call into one span, so a trace names both services, and its
annotations mark when the agent sent the call and the proxy answered it. A connection's scrape streams are traced too,
and appear as the connection closes, each about 15 seconds long: as long as the connection lasted.
The whole WAN goes down: an alert fires, and the agents reconnect
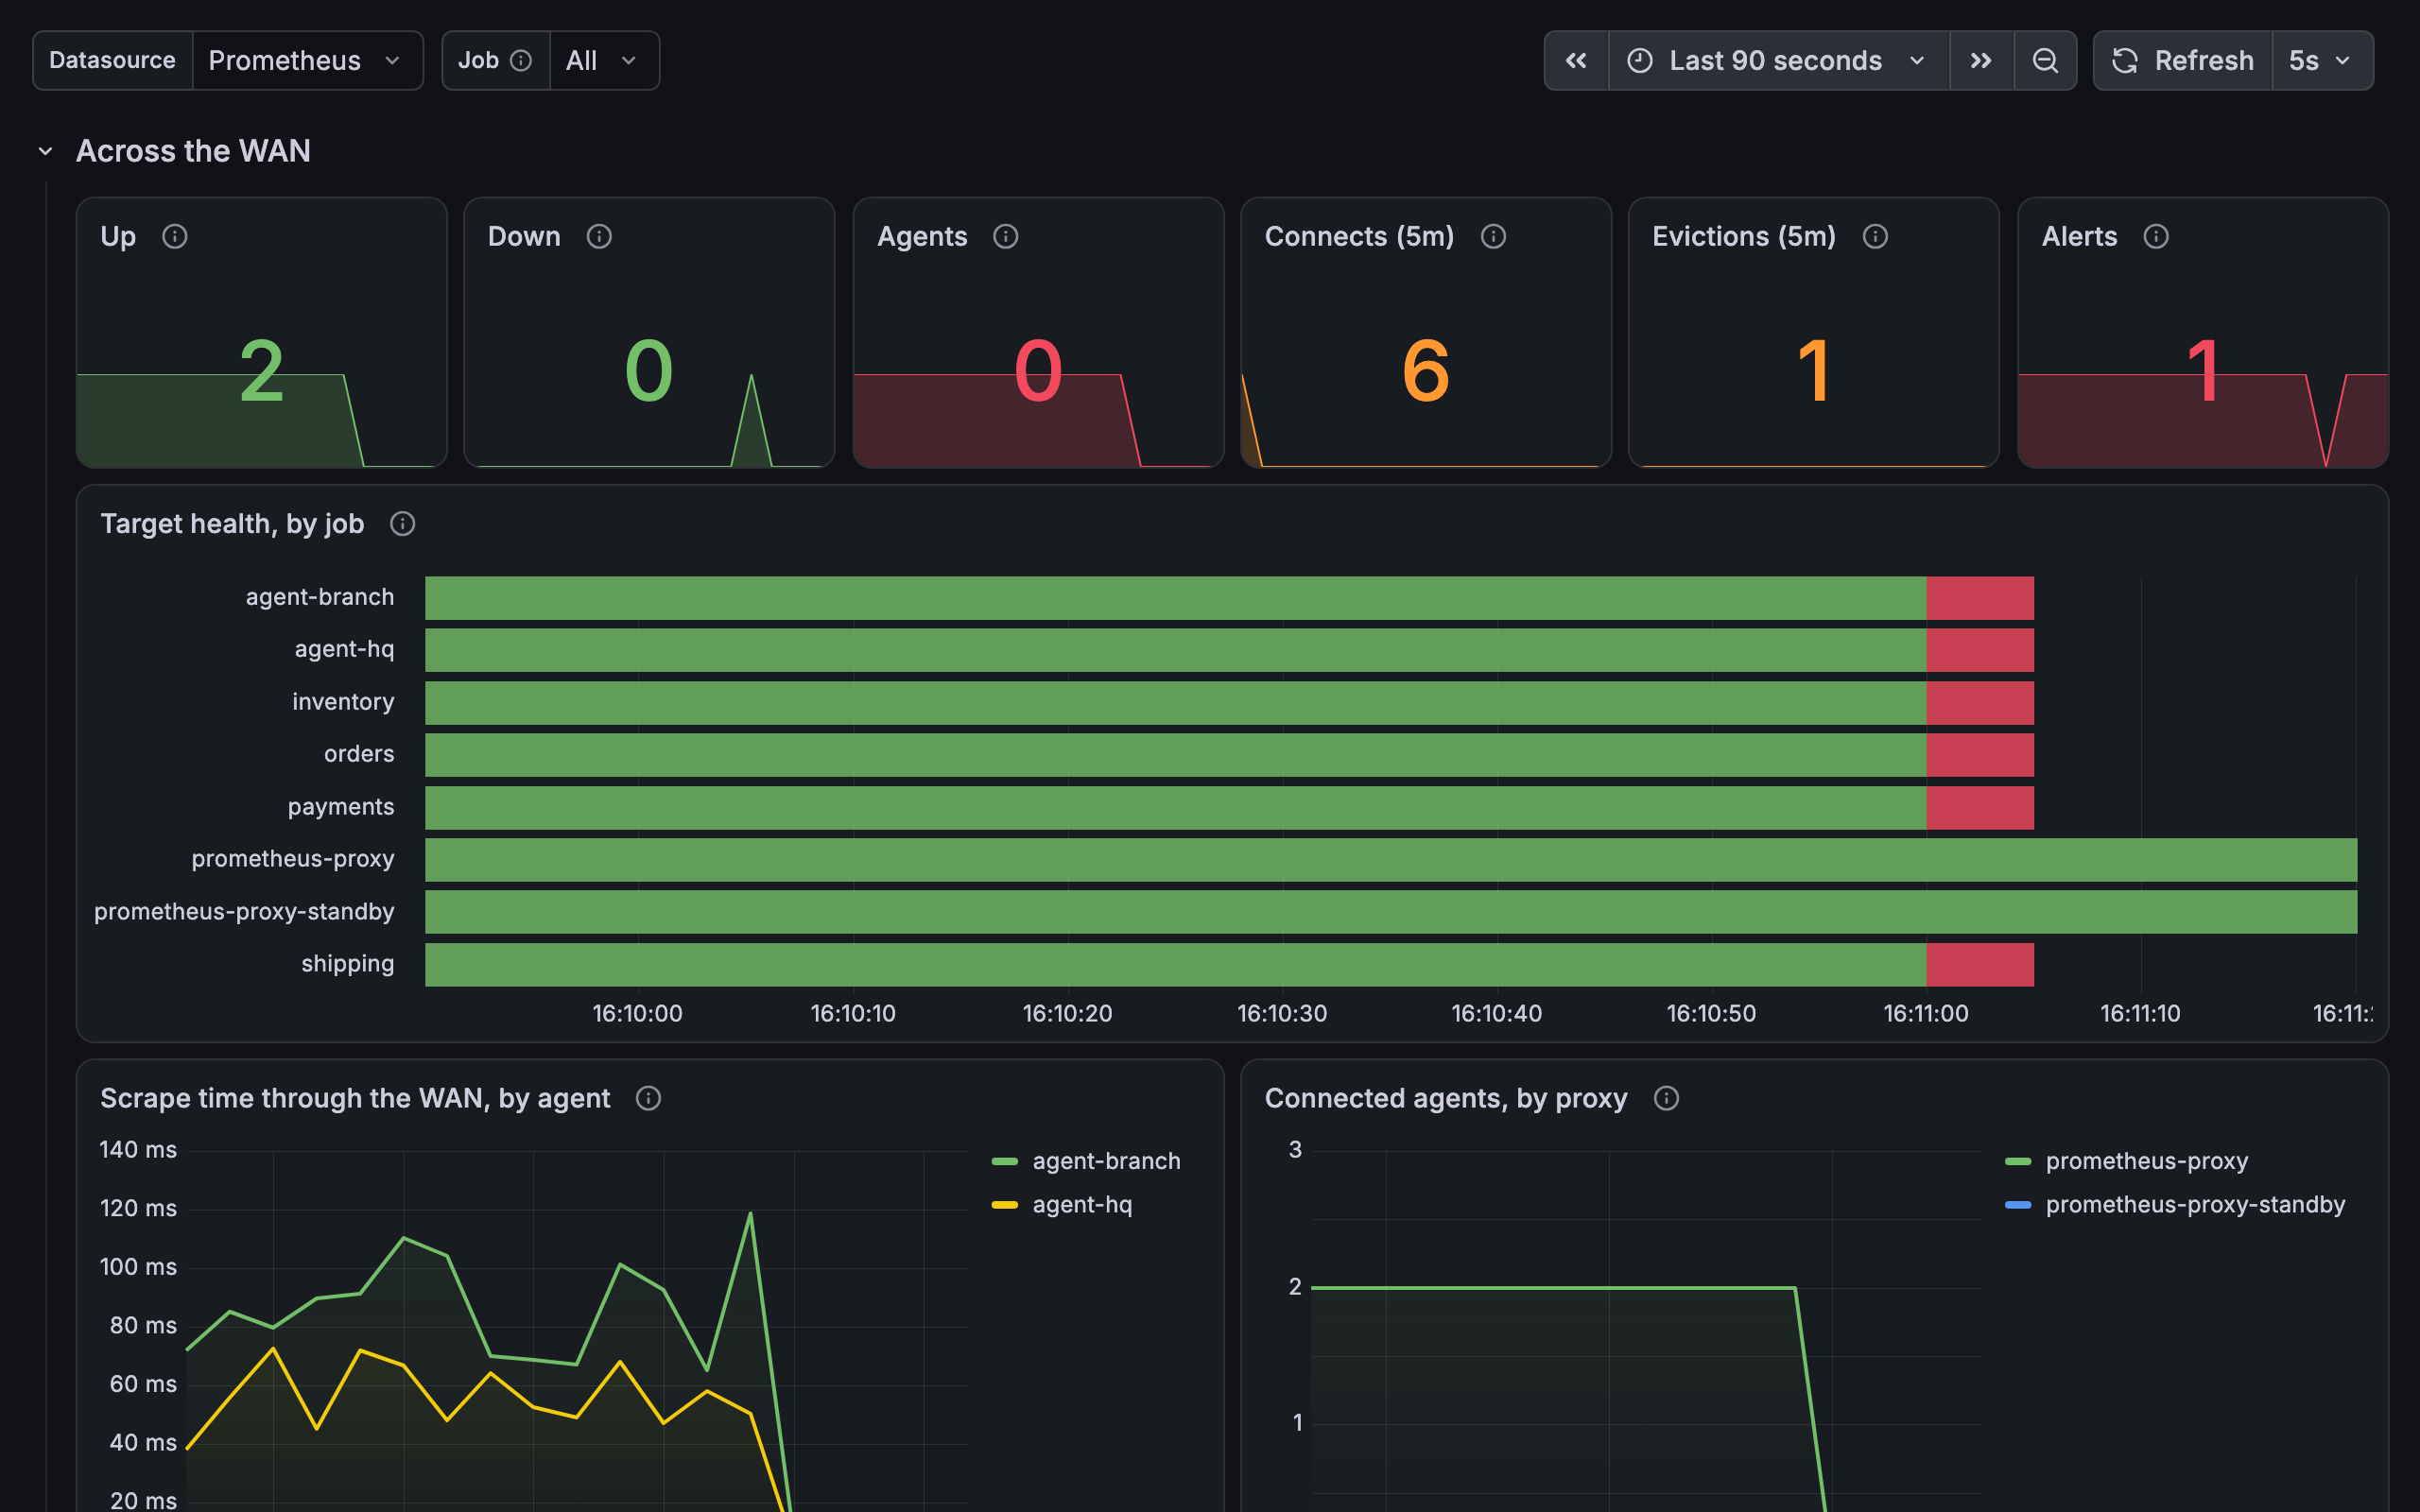
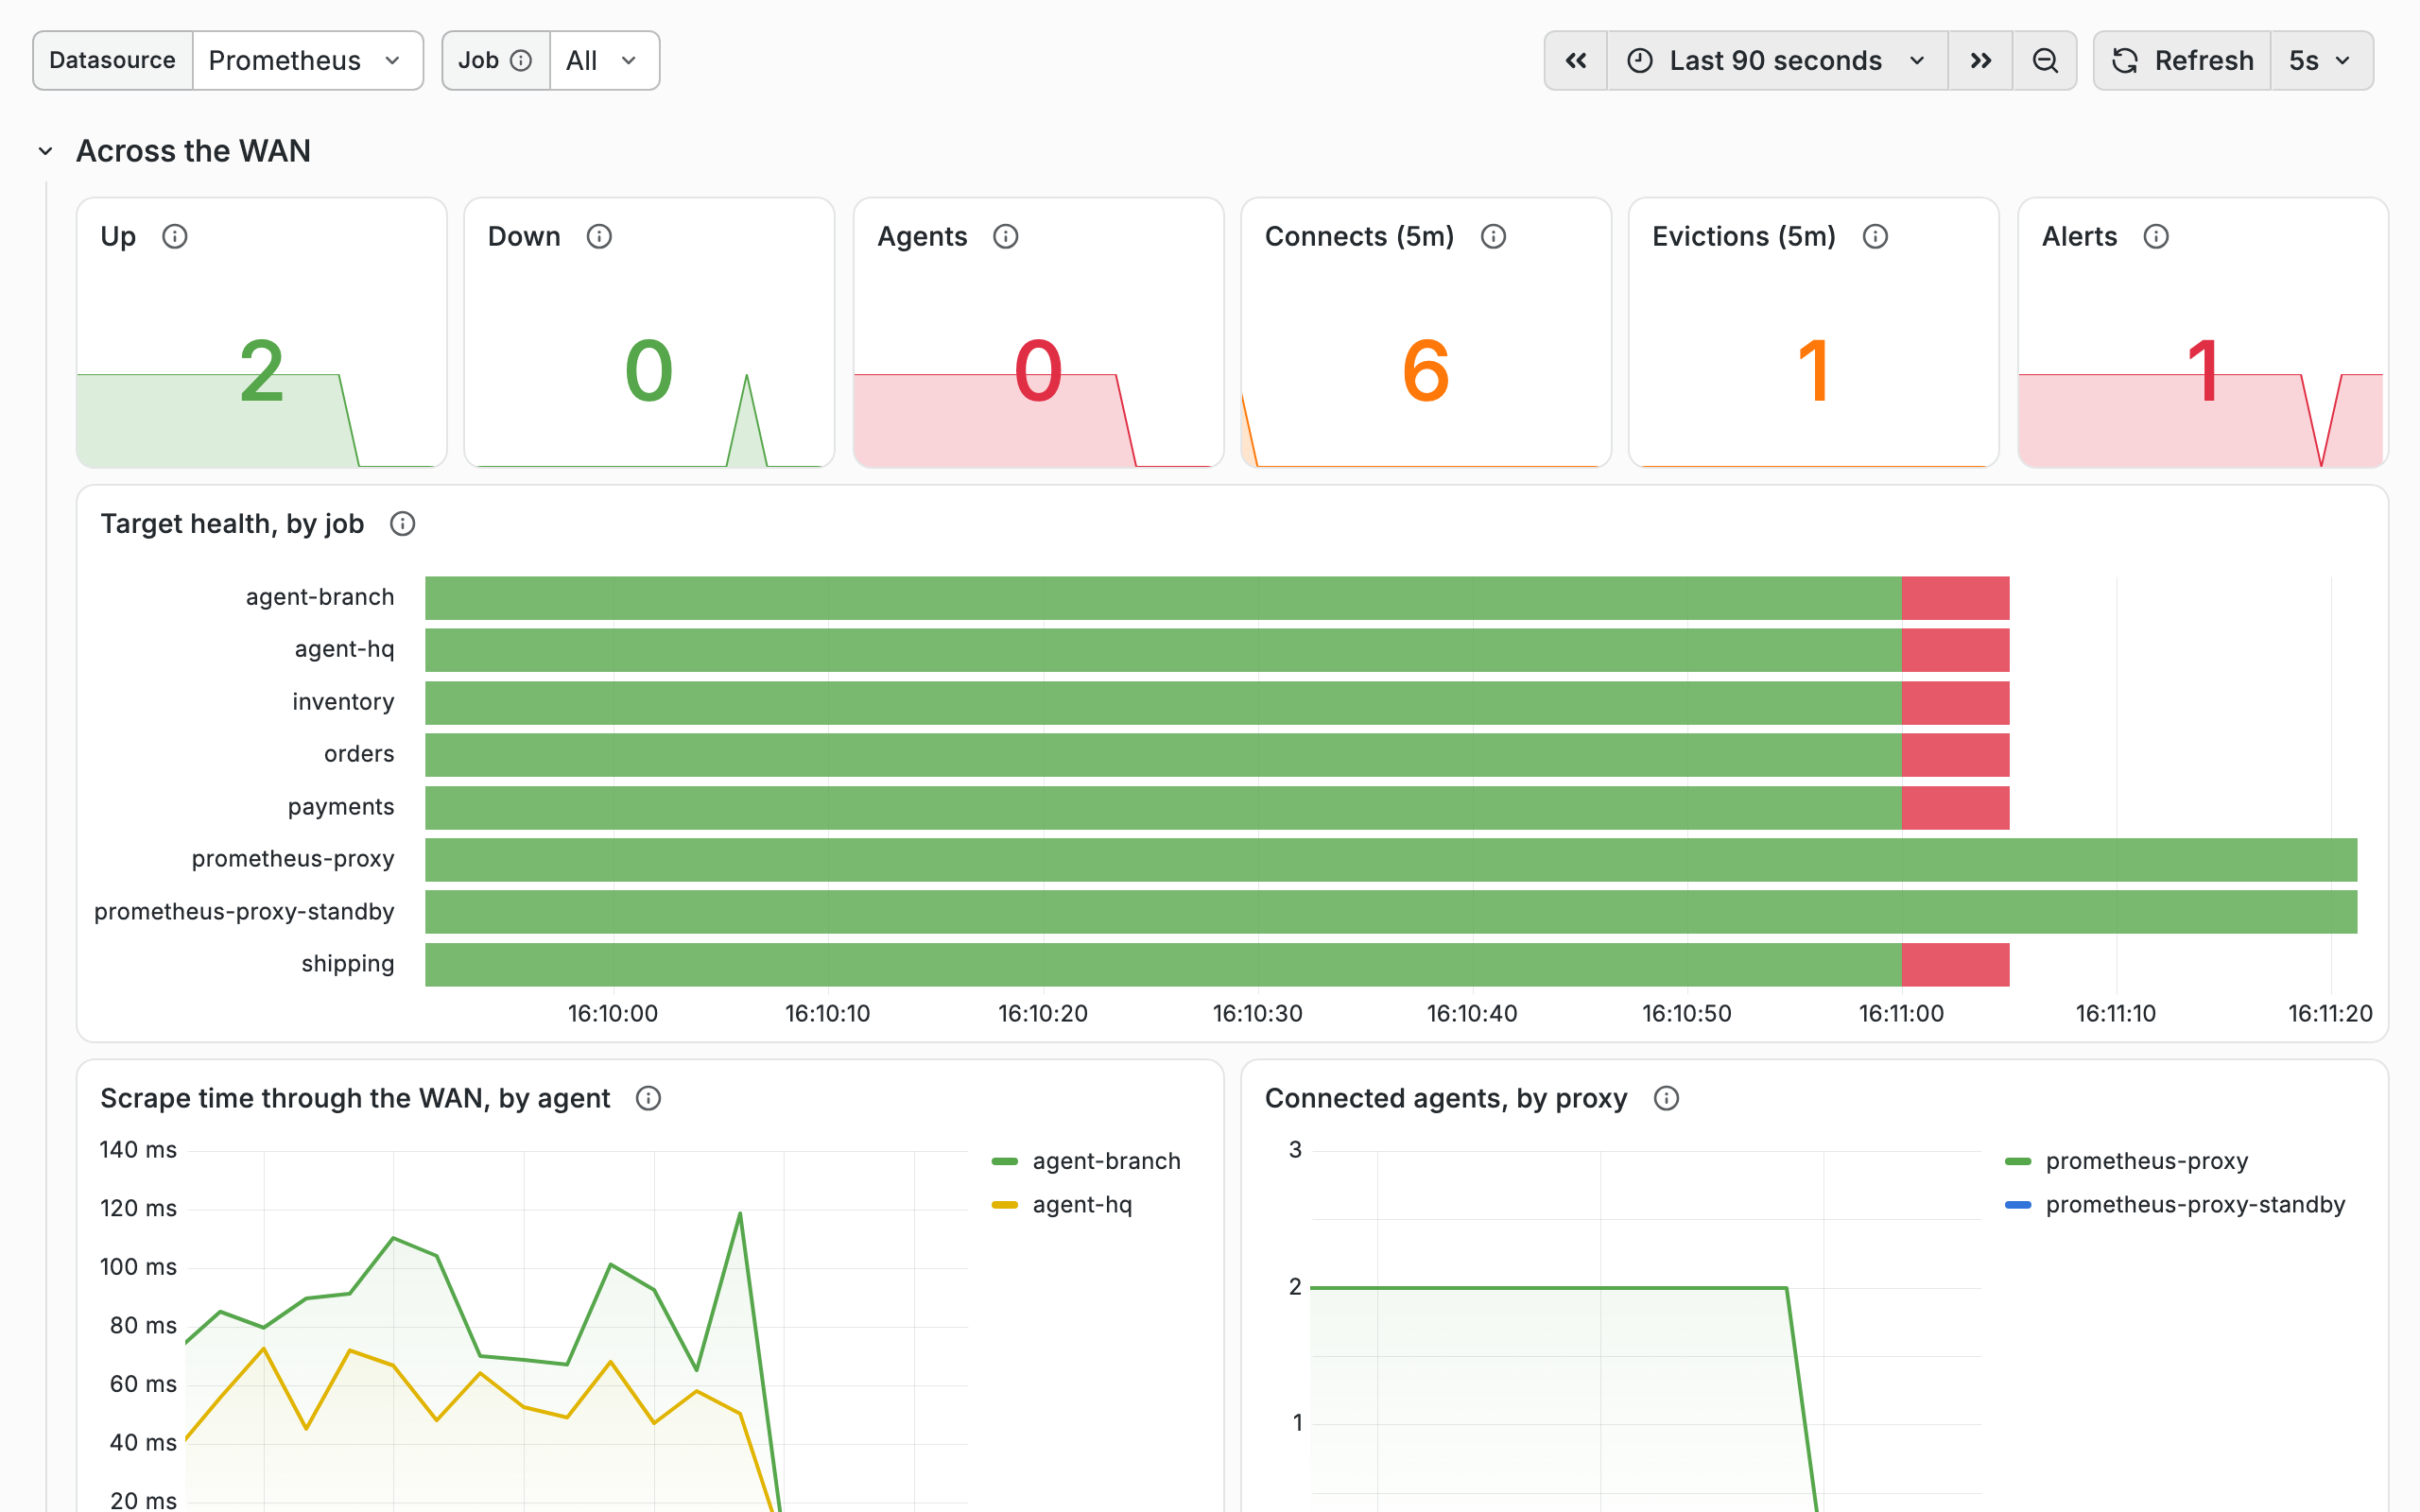
Both agents leave both dashboards at once, and retry every 3 seconds, alternating between their two links. A proxy's
/discovery lists only the paths of the agents connected to it, so within about 15 seconds their targets vanish from
Prometheus rather than staying red: on Target health their rows go red for a scrape or two, then stop. Prometheus
scrapes the proxies directly, on its own side of the WAN, so it still
sees them: at about 20 seconds NetworkNoAgentsConnected, built on proxy_agent_map_size, fires.
./demo.sh wan-up brings the links back. Within a few seconds each agent reconnects, through whichever of its links it
tries next, so one may land on the standby, and the alert resolves, leaving a gap in the graphs where nothing could be
scraped. ./demo.sh heal returns any agent on the standby to the primary.
Scenario reference
| Command | Effect | How it works |
|---|---|---|
demo.sh far [agent] |
Adds 250 ms of latency, give or take 50 ms, each way on both of the agent's links | A Toxiproxy latency toxic each way on both links |
demo.sh thin [agent] |
Caps both of the agent's links at 8 KB/s toward the proxies | A Toxiproxy bandwidth toxic toward the proxies on both links |
demo.sh filter / unfilter |
Restarts agent-branch with or without the inventory filter | Recreates agent-branch's container with config/agent-branch-filtered.conf, whose agent.filters drops inventory_item_price_dollars, or with config/agent-branch.conf |
demo.sh proxy-down / proxy-up [proxy] |
Stops or starts a proxy (default proxy, the primary; or proxy-standby) |
docker compose stop / start; an agent whose connection closes dials its next endpoint |
demo.sh cut [agent] |
Silences the agent's link to the primary, both ways, closes included | Two timeout toxics with a timeout of 0, which drop all data, and two slow_close toxics, which hold the closes |
demo.sh flaky [agent] |
Closes each connection through the agent's link to the primary after about 15 seconds of its traffic | A limit_data toxic, which closes each connection after a set number of bytes |
demo.sh wan-down / wan-up |
Takes every link down, or brings every link back | Disables or enables all four Toxiproxy links; a disabled link closes its connections and refuses new ones |
demo.sh heal |
Removes every change to the WAN, brings back every link and proxy, and returns any agent on the standby to the primary | Removes the toxics, enables the links, starts the proxies, and disables an agent's link to the standby for a second, so it reconnects to the primary |
make tour [PART=n] |
Walks through every scenario, from part 1 or the one given, pausing before each step | |
make status |
The containers, each link's state and changes, and the URLs | |
make logs [SERVICE=name] |
Follows the logs, of every service or the one given | |
make open |
Opens both dashboards, Grafana, and Prometheus's alerts in the browser |
The optional [agent] is agent-branch, the default, or agent-hq. heal and unfilter undo every scenario. For a
clean slate, make down && make up.
Going further
- The demo's README has these scenarios as a guided tour, explaining how each one works, and lists the files that set the demo up, including which Toxiproxy toxic each scenario uses.
- The Kubernetes Demo deploys the same proxy and agent with their Helm charts on two kind
clusters, and shows Kubernetes driving the agent's targets and replacing its pod. It needs kind,
kubectl, and Helm as well as Docker. - Running in Production covers a standby proxy and the agent's ordered endpoints.
- Advanced Topics covers how the proxy evicts a silent agent.