Embedded Demo
The repository ships a demo of the agent embedded in an app: a coffee shop, a small Ktor app with built-in customers, runs the agent inside its own JVM. The agent connects to a proxy, and Prometheus and Grafana sit beside the proxy. It's the setup Cloud Platforms describes, with the app on ECS, Cloud Run, or Azure Container Apps and the proxy on another host, run on one machine.
%%{init: {'flowchart': {'curve': 'linear'}}}%%
graph LR
  G[Grafana :3000] --> P[Prometheus :9090]
  P -->|scrapes /coffee_shop_metrics| Proxy[Proxy, dashboard :8094]
  %% The agent connects out to the proxy, so its arrow points back. The invisible link keeps the app to the right.
  Proxy ~~~ Agent
  Agent[embedded agent] -->|gRPC over TLS, with a token| Proxy
  Agent -->|reads /metrics on 127.0.0.1| App[coffee shop: Ktor]
  LB[load balancer :8390] --> App

  subgraph Proxy host
    G
    P
    Proxy
  end

  subgraph The app's platform
    LB
    Agent
    App
  end
What you need
On macOS or Linux, the demo needs:
- Docker with Compose v2: Docker Desktop, or Docker Engine with the Compose plugin.
git, to clone the repository, and GNUmake. On macOS, the Xcode command-line tools (xcode-select --install) have both. Where GNU make is installed asgmake, typegmakewherever these instructions saymake.curl, which the demo uses to wait for each service to answer, and to turn the coffee shop's knobs.- A web browser.
make up runs the latest release's proxy image, from Docker Hub, and builds the coffee shop inside Docker against the
latest release's library, from Maven Central, so it needs no JDK.
Running it
Clone the repository at the latest release, then run the demo's commands from its own directory, where make help lists
its targets:
git clone -c advice.detachedHead=false --depth 1 --branch 4.6.0 https://github.com/pambrose/prometheus-proxy.git
cd prometheus-proxy/demos/embedded
make up      # builds the coffee shop, starts everything, prints the URLs
make tour    # walks through every scenario below, pausing before each step
make down    # stops it and removes its containers and network
The first make up pulls the images and builds the coffee shop, which takes a few minutes. After that it starts in
under a minute.
| What | URL |
|---|---|
| The coffee shop, through its load balancer | http://localhost:8390 |
| Proxy dashboard | http://localhost:8394/dashboard |
| Grafana (no sign-in needed; admin / admin to edit) | http://localhost:3300 |
| Prometheus | http://localhost:9390 (alerts at /alerts) |
| The coffee shop's metrics, through the proxy | http://localhost:8380/coffee_shop_metrics |
The ports are the Basics Demo's plus 300, so the two can run side by side. Every port binds to
127.0.0.1 only. To move one that is already taken, set EMBEDDED_DEMO_APP_PORT, EMBEDDED_DEMO_DASHBOARD_PORT,
EMBEDDED_DEMO_GRAFANA_PORT, EMBEDDED_DEMO_PROMETHEUS_PORT, or EMBEDDED_DEMO_PROXY_PORT, for example
EMBEDDED_DEMO_GRAFANA_PORT=3301 make up.
What's running
| Service | Role |
|---|---|
coffee-shop |
The app, version 1.0: a Ktor server whose built-in customers order over HTTP, and whose baristas brew from a queue. It serves its metrics, with Ktor's HTTP and the JVM's, at /metrics behind Basic Auth. The agent runs inside it, started with embeddedAgent { } from settings the app builds in code, and reads /metrics on 127.0.0.1. |
coffee-shop-next |
Started only by demo.sh deploy: version 1.1 of the same image, beside 1.0, as a rolling deploy does. |
load-balancer |
The coffee shop's one address, on port 8390, as a platform's load balancer is: it sends every request to 1.0, or to 1.1 once a deploy has stopped 1.0. |
proxy |
The stock proxy image. It takes its TLS certificate and key as PEM in environment variables, and the agent's token from one too, with no file mounted. |
prometheus |
Scrapes the coffee shop's paths through the proxy every 5 seconds, and the proxy's own metrics, and loads the project's alerting rules and the coffee shop's. |
grafana |
Opens on the Coffee Shop dashboard, which links to the two dashboards the project ships. |
The secrets are the repository's test certificates, a token, and a password, which make up writes to the demo's
docker/.env the first time it runs. The certificates are public, so this suits a laptop and nothing shared;
Cloud Platforms shows how to make your own.
The app and its agent
Select any screenshot on this page to see it full size.
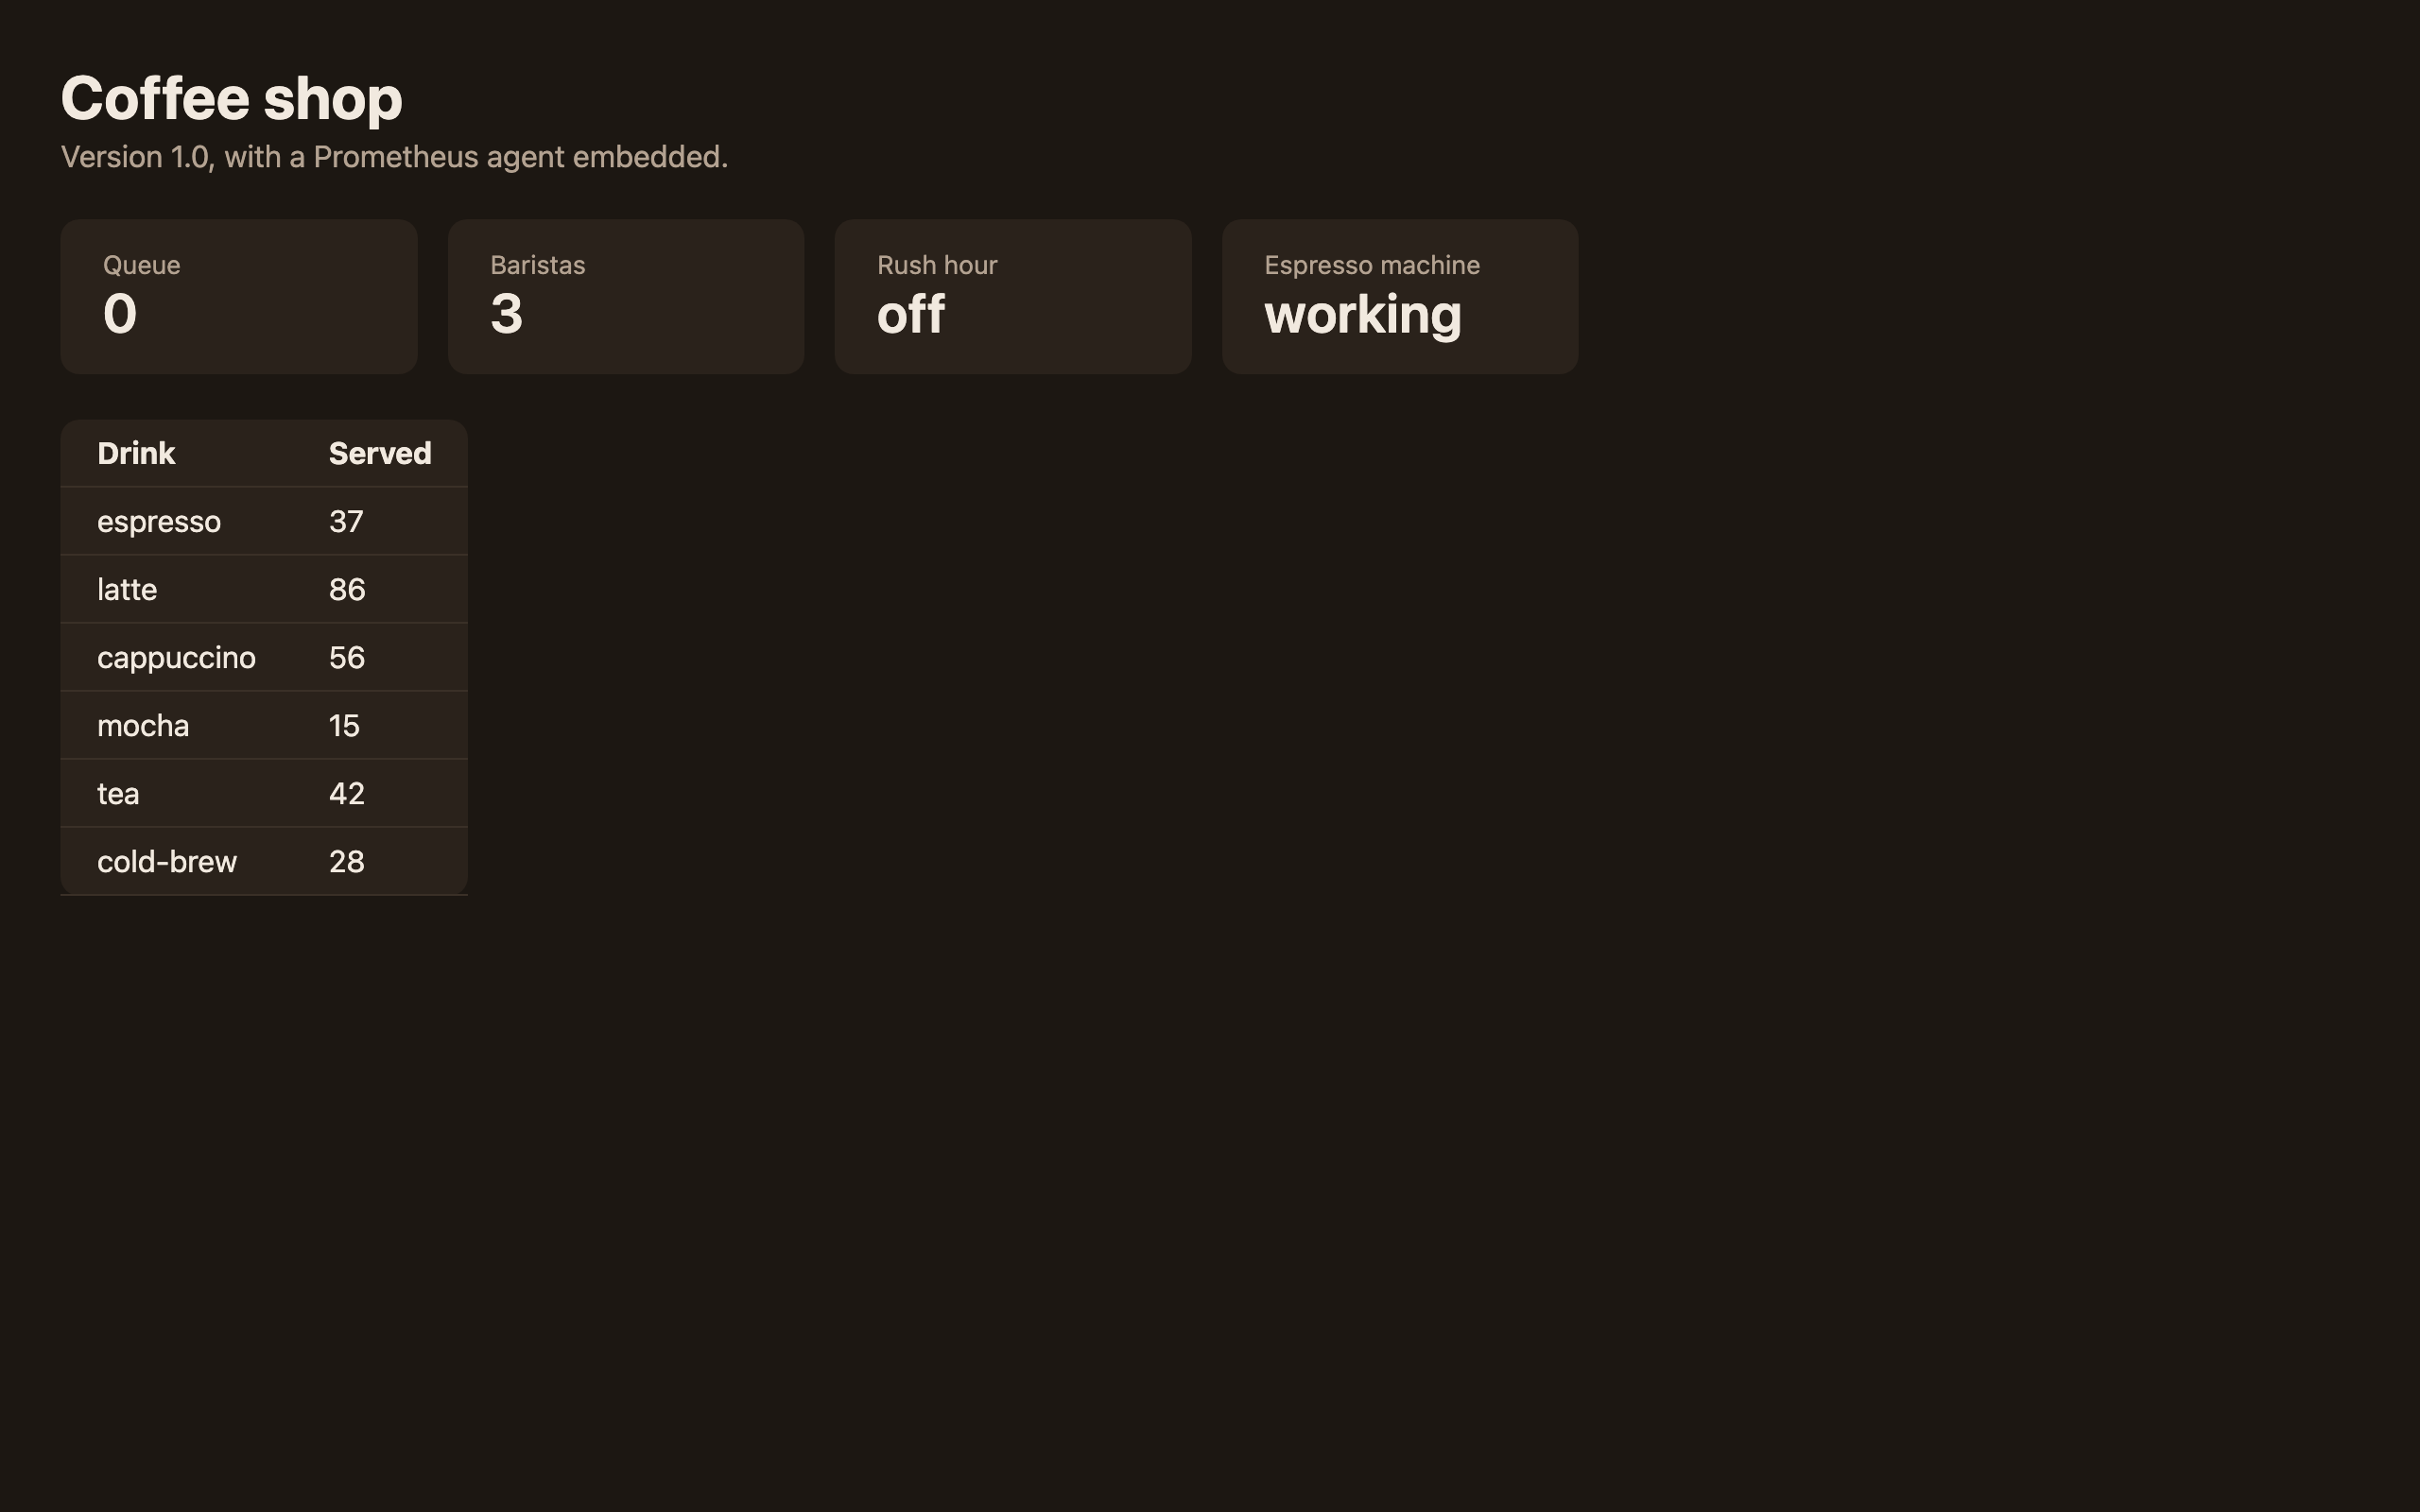
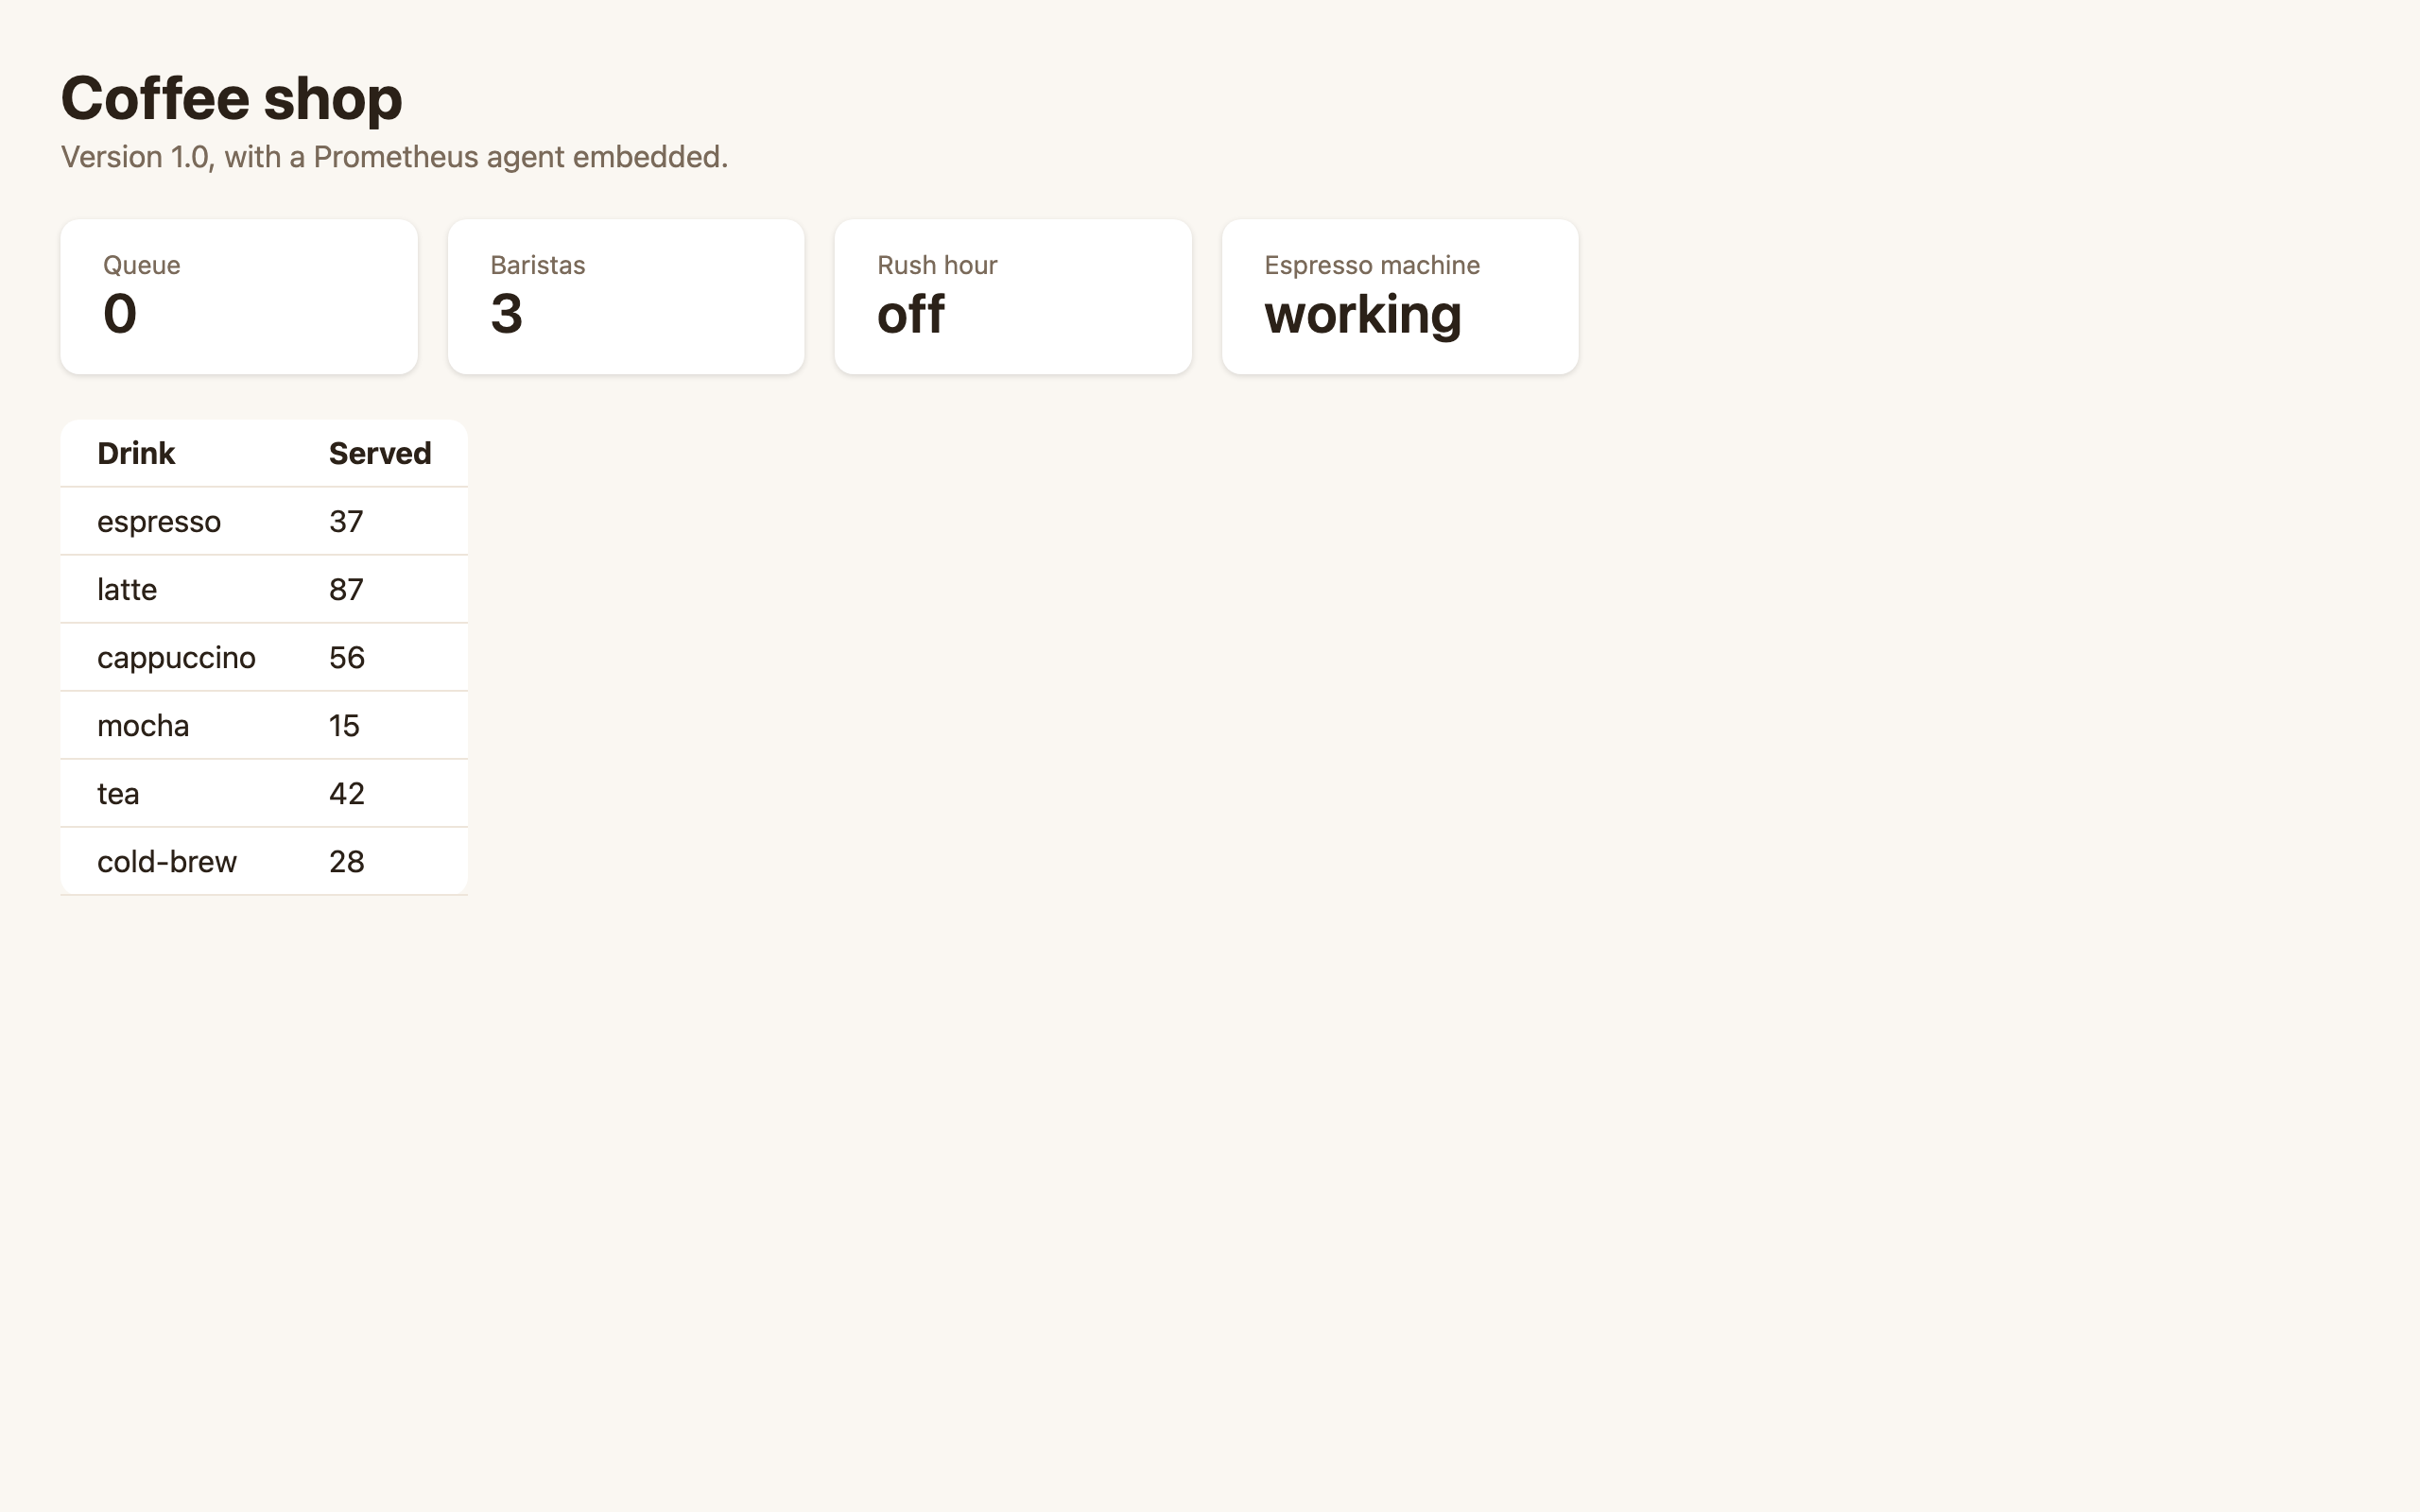
The coffee shop's status page shows the queue, the baristas on shift, and the drinks served. Its /metrics answers 401
without the password; ./demo.sh peek shows it, then reads the same metrics through the proxy, where Prometheus finds
them. The agent reads /metrics on 127.0.0.1 with the credentials it holds, so Prometheus never needs the password or
a way into the app.
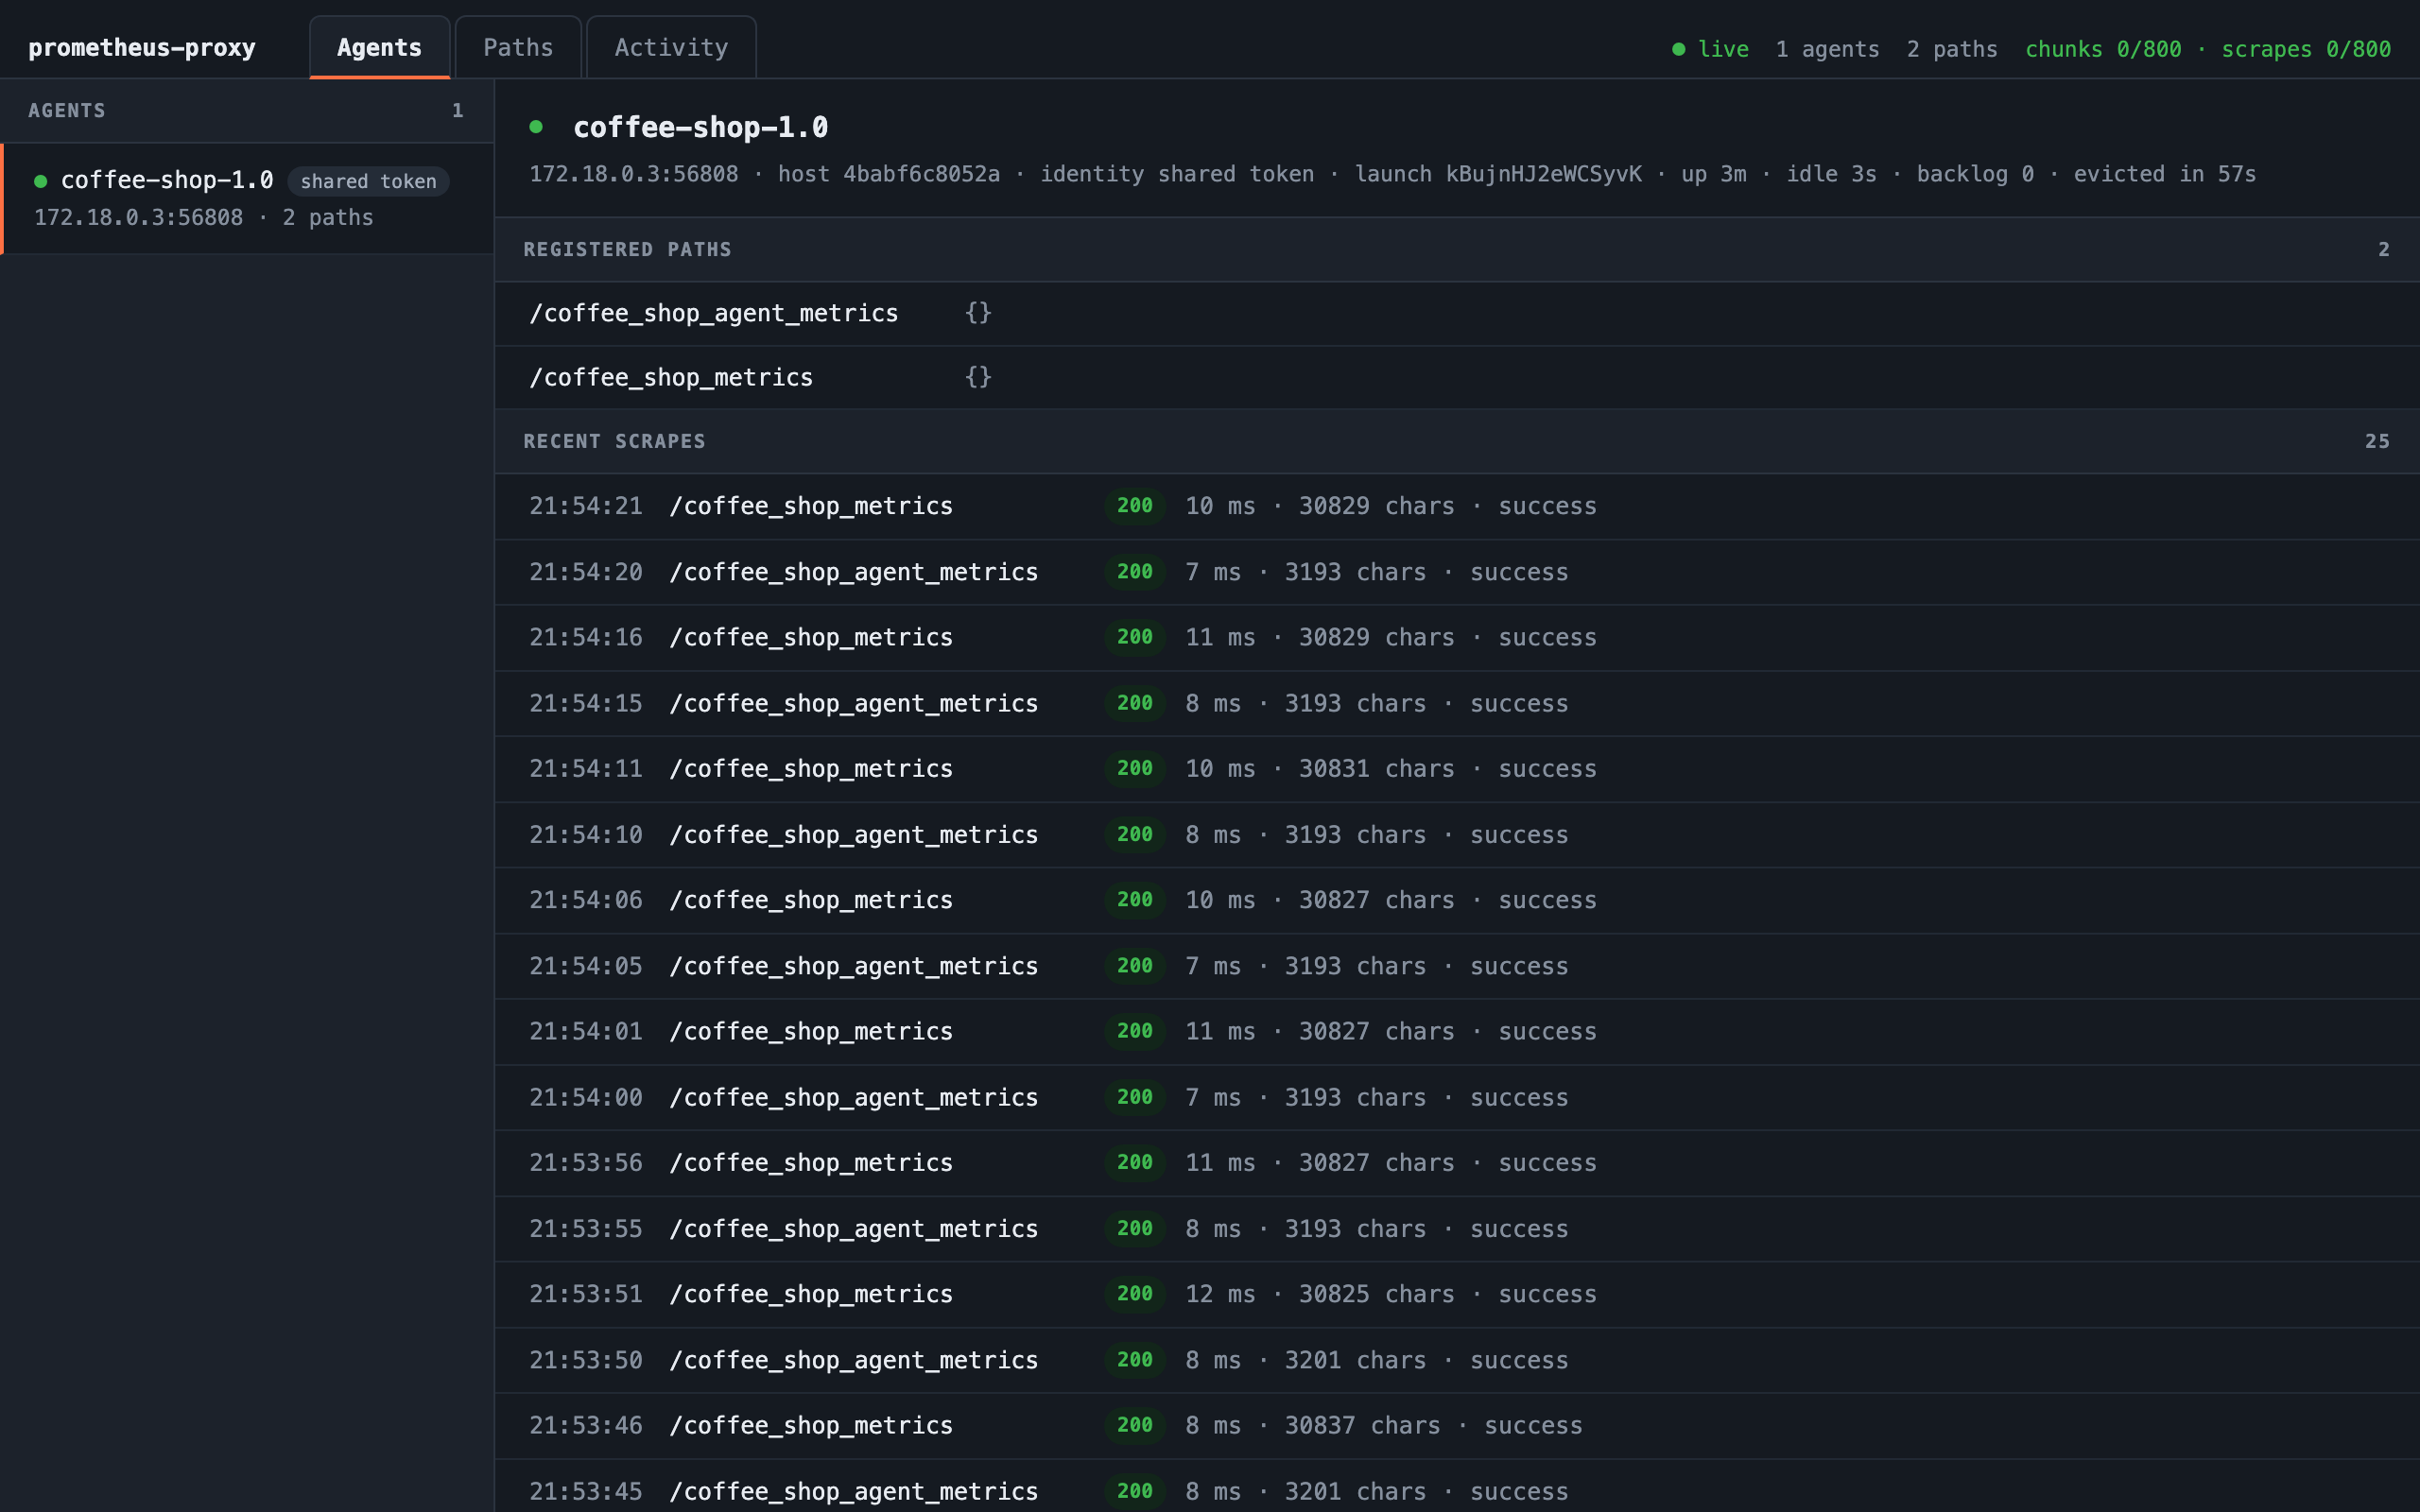
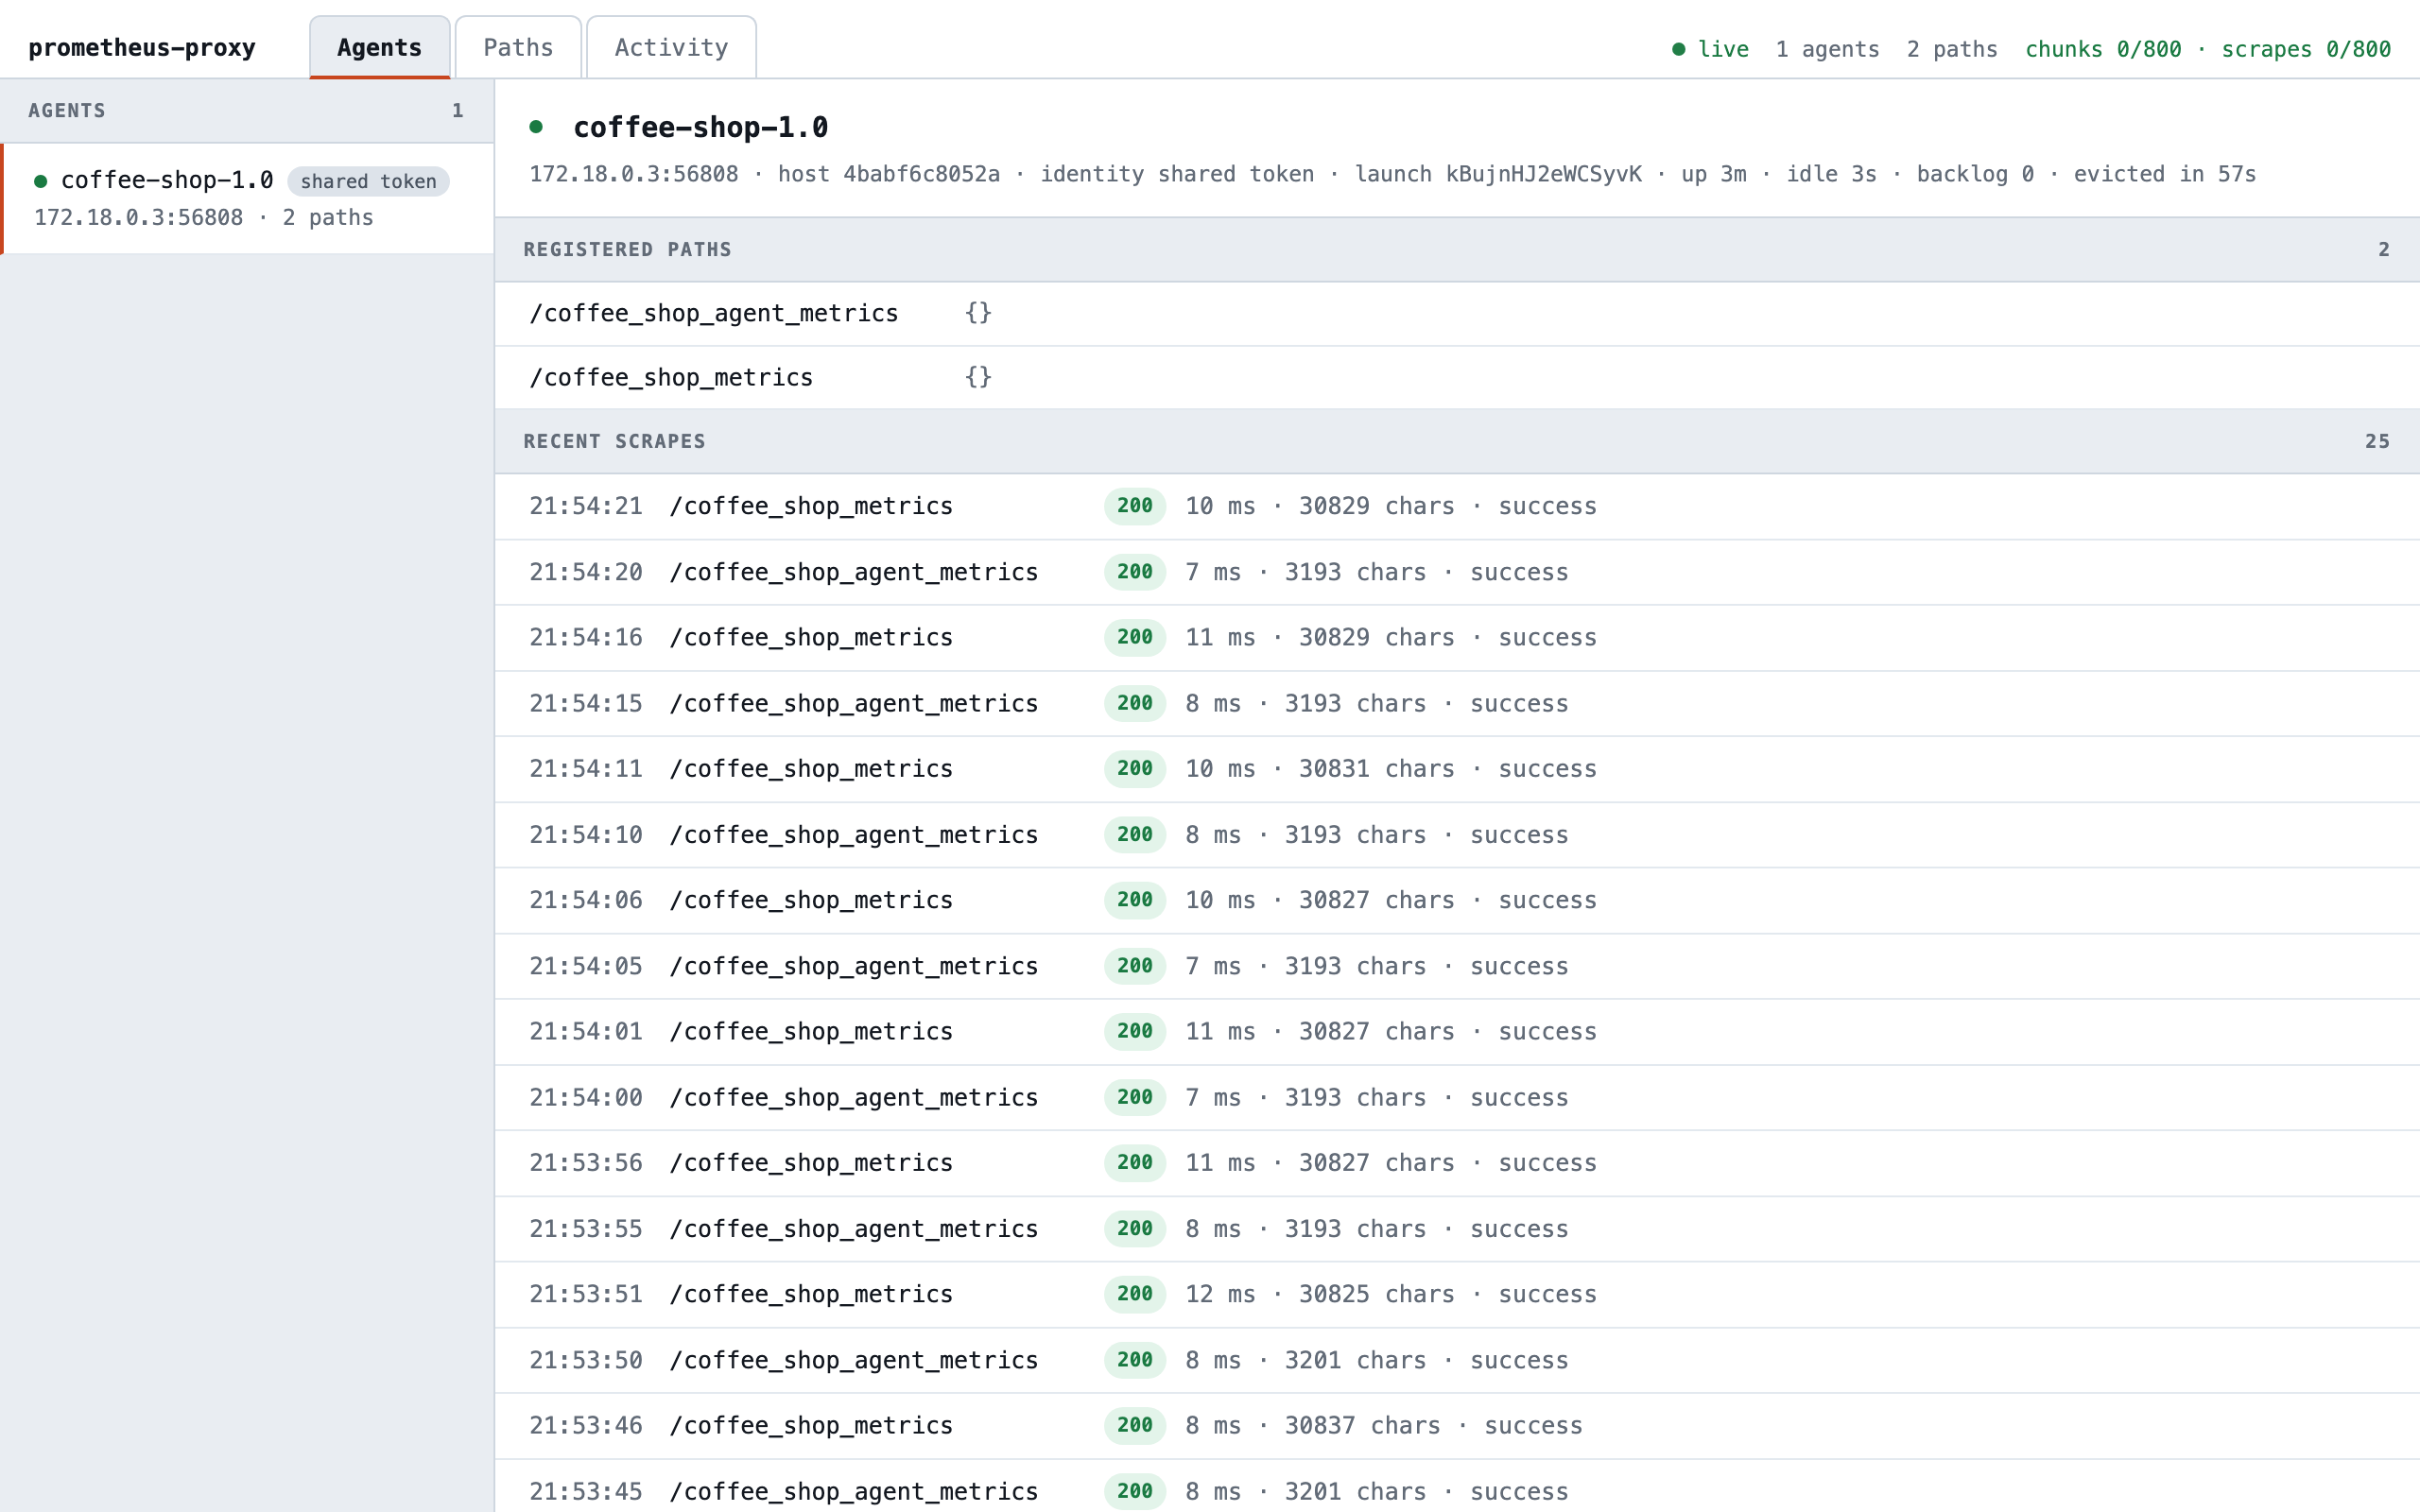
On the proxy dashboard, the embedded agent is an agent like any other: coffee-shop-1.0, named after the app's version,
with two paths, the coffee shop's metrics and its own, and its scrapes as they happen.
Where the agent is configured
The coffee shop configures its agent in code, with no config file. startPrometheusAgent, in
PrometheusAgent.kt,
builds the agent's settings from the app's environment with
embeddedAgent { } and starts it:
/**
 * Starts the prometheus-proxy agent embedded in the shop, from the app's own settings, in memory: no config file holds
 * the token, the proxy's certificate, or the password for /metrics. It connects to the proxy, so the app opens no port
 * for Prometheus, and answers each scrape by reading the app's /metrics on 127.0.0.1. It's named after [appVersion],
 * so the proxy's dashboard and logs tell the old and new versions apart during a deploy.
 *
 * Returns null when the agent is off, without PROMETHEUS_PROXY, or can't start: the shop's metrics aren't worth an
 * outage, so it keeps serving either way.
 */
fun startPrometheusAgent(
  appPort: Int,
  appVersion: String,
): EmbeddedAgentInfo? {
  // host:port, the proxy's agent port
  val proxyEndpoint = env("PROMETHEUS_PROXY").ifEmpty {
    logger.info { "PROMETHEUS_PROXY isn't set, so the Prometheus agent stays off" }
    return null
  }
  return try {
    embeddedAgent {
      // The version tells the old and new deployments apart on the proxy's dashboard and in its logs
      name = "coffee-shop-$appVersion"
      proxy = proxyEndpoint
      token = env("PROMETHEUS_AGENT_TOKEN")
      // The certificate the proxy's is signed with, as PEM or its base64, and the name it was issued to
      trustCertificatePem(
        pem = env("PROMETHEUS_PROXY_CERT"),
        authority = env("PROMETHEUS_PROXY_AUTHORITY").ifEmpty { "prometheus-proxy" },
      )
      // The app's own /metrics; the agent sends the credentials as Basic Auth
      scrapeSelf(
        path = "coffee_shop_metrics",
        port = appPort,
        username = env("METRICS_USER"),
        password = env("METRICS_PASSWORD"),
      )
      // The agent's own metrics, which it serves the proxy too
      agentMetricsPort = AGENT_METRICS_PORT
      scrapeSelf(path = "coffee_shop_agent_metrics", port = AGENT_METRICS_PORT)
    }.start(logBanner = false).also { agent ->
      logger.info { "Prometheus agent ${agent.agentName} started; it connects to the proxy at $proxyEndpoint" }
    }
  } catch (e: ConfigLoadException) {
    logger.error { "The Prometheus agent's settings are invalid, so it stays off: ${e.message}" }
    null
  } catch (e: IllegalStateException) {
    logger.error { "The Prometheus agent could not start, so it stays off: ${e.message}" }
    null
  }
}
The app's Ktor module, coffeeShop in
Main.kt,
starts the agent and stops it with the app:
// The app's version, which its page, /status, and its agent's name show, so a deploy can be told apart from the last.
private val version = env("APP_VERSION").ifEmpty { "dev" }

fun Application.coffeeShop(port: Int) {
  // Ktor's HTTP metrics (ktor_http_server_requests_seconds) and the JVM's, then the shop's, in one registry. The plugin
  // goes first: it configures the registry, which Micrometer wants done before any meter is registered.
  val registry = PrometheusMeterRegistry(PrometheusConfig.DEFAULT)
  install(MicrometerMetrics) { this.registry = registry }
  val shop = CoffeeShop(ShopMetrics(registry))
  installMetricsLogin()

  routing {
    shopRoutes(shop)
    // The metrics the agent reads, behind the login above
    authenticate("metrics") {
      get("/metrics") {
        call.respondText(registry.scrape(), ContentType.parse("text/plain; version=0.0.4; charset=utf-8"))
      }
    }
    adminRoutes(shop)
  }

  shop.open(this)
  Customers(shop, port).start(this)
  // Once the routes are in place, so the agent's first scrape finds /metrics.
  val agent = startPrometheusAgent(port, version)
  monitor.subscribe(ApplicationStopped) { agent?.shutdown() }
}
- The app depends on
com.pambrose:prometheus-proxy, as Adding the Dependency shows; the demo's build uses the latest release (make up) or this checkout (make up-local). - Its image is built from
app/Dockerfile, as Packaging the App describes, with a second way in that copies in a build made on the host, formake up-local. - The environment comes from the demo's
docker/compose.yml, whosex-coffee-shop-envblock gives the proxy's address and the name its certificate was issued to, and reads the token, the CA certificate, and the password for/metricsfromdocker/.env, whichmake upwrites the first time it runs.
The coffee shop in Grafana
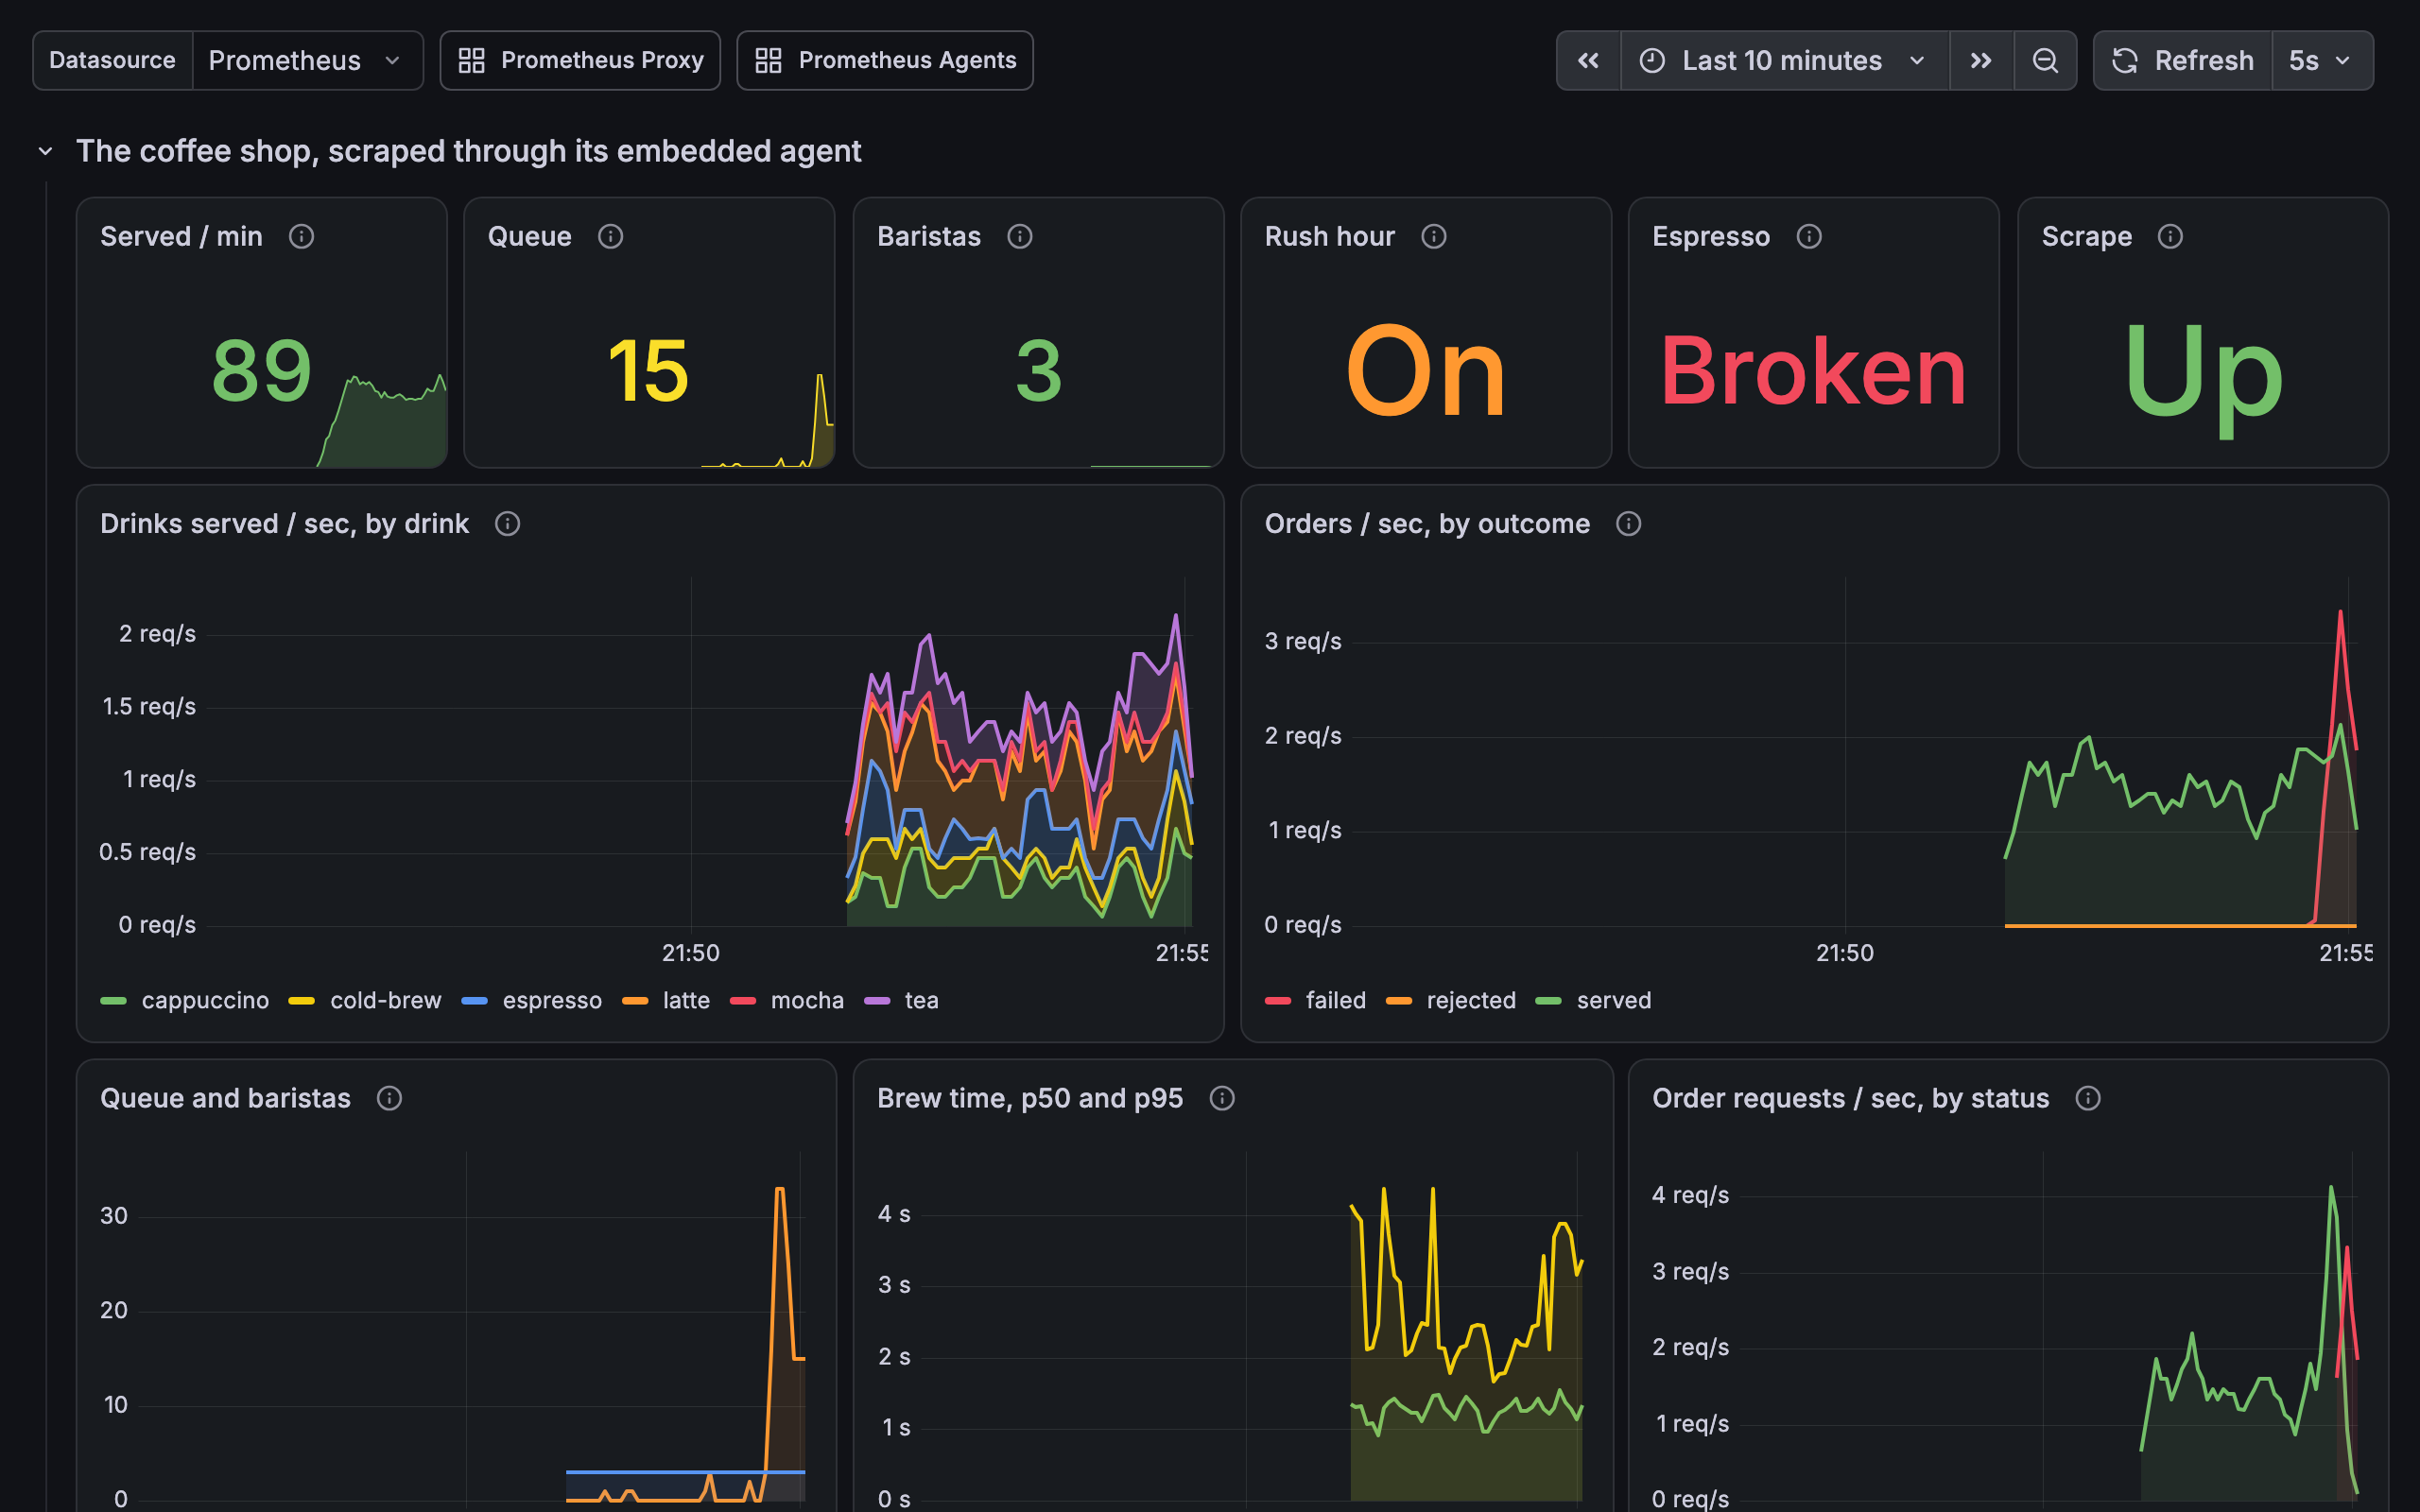
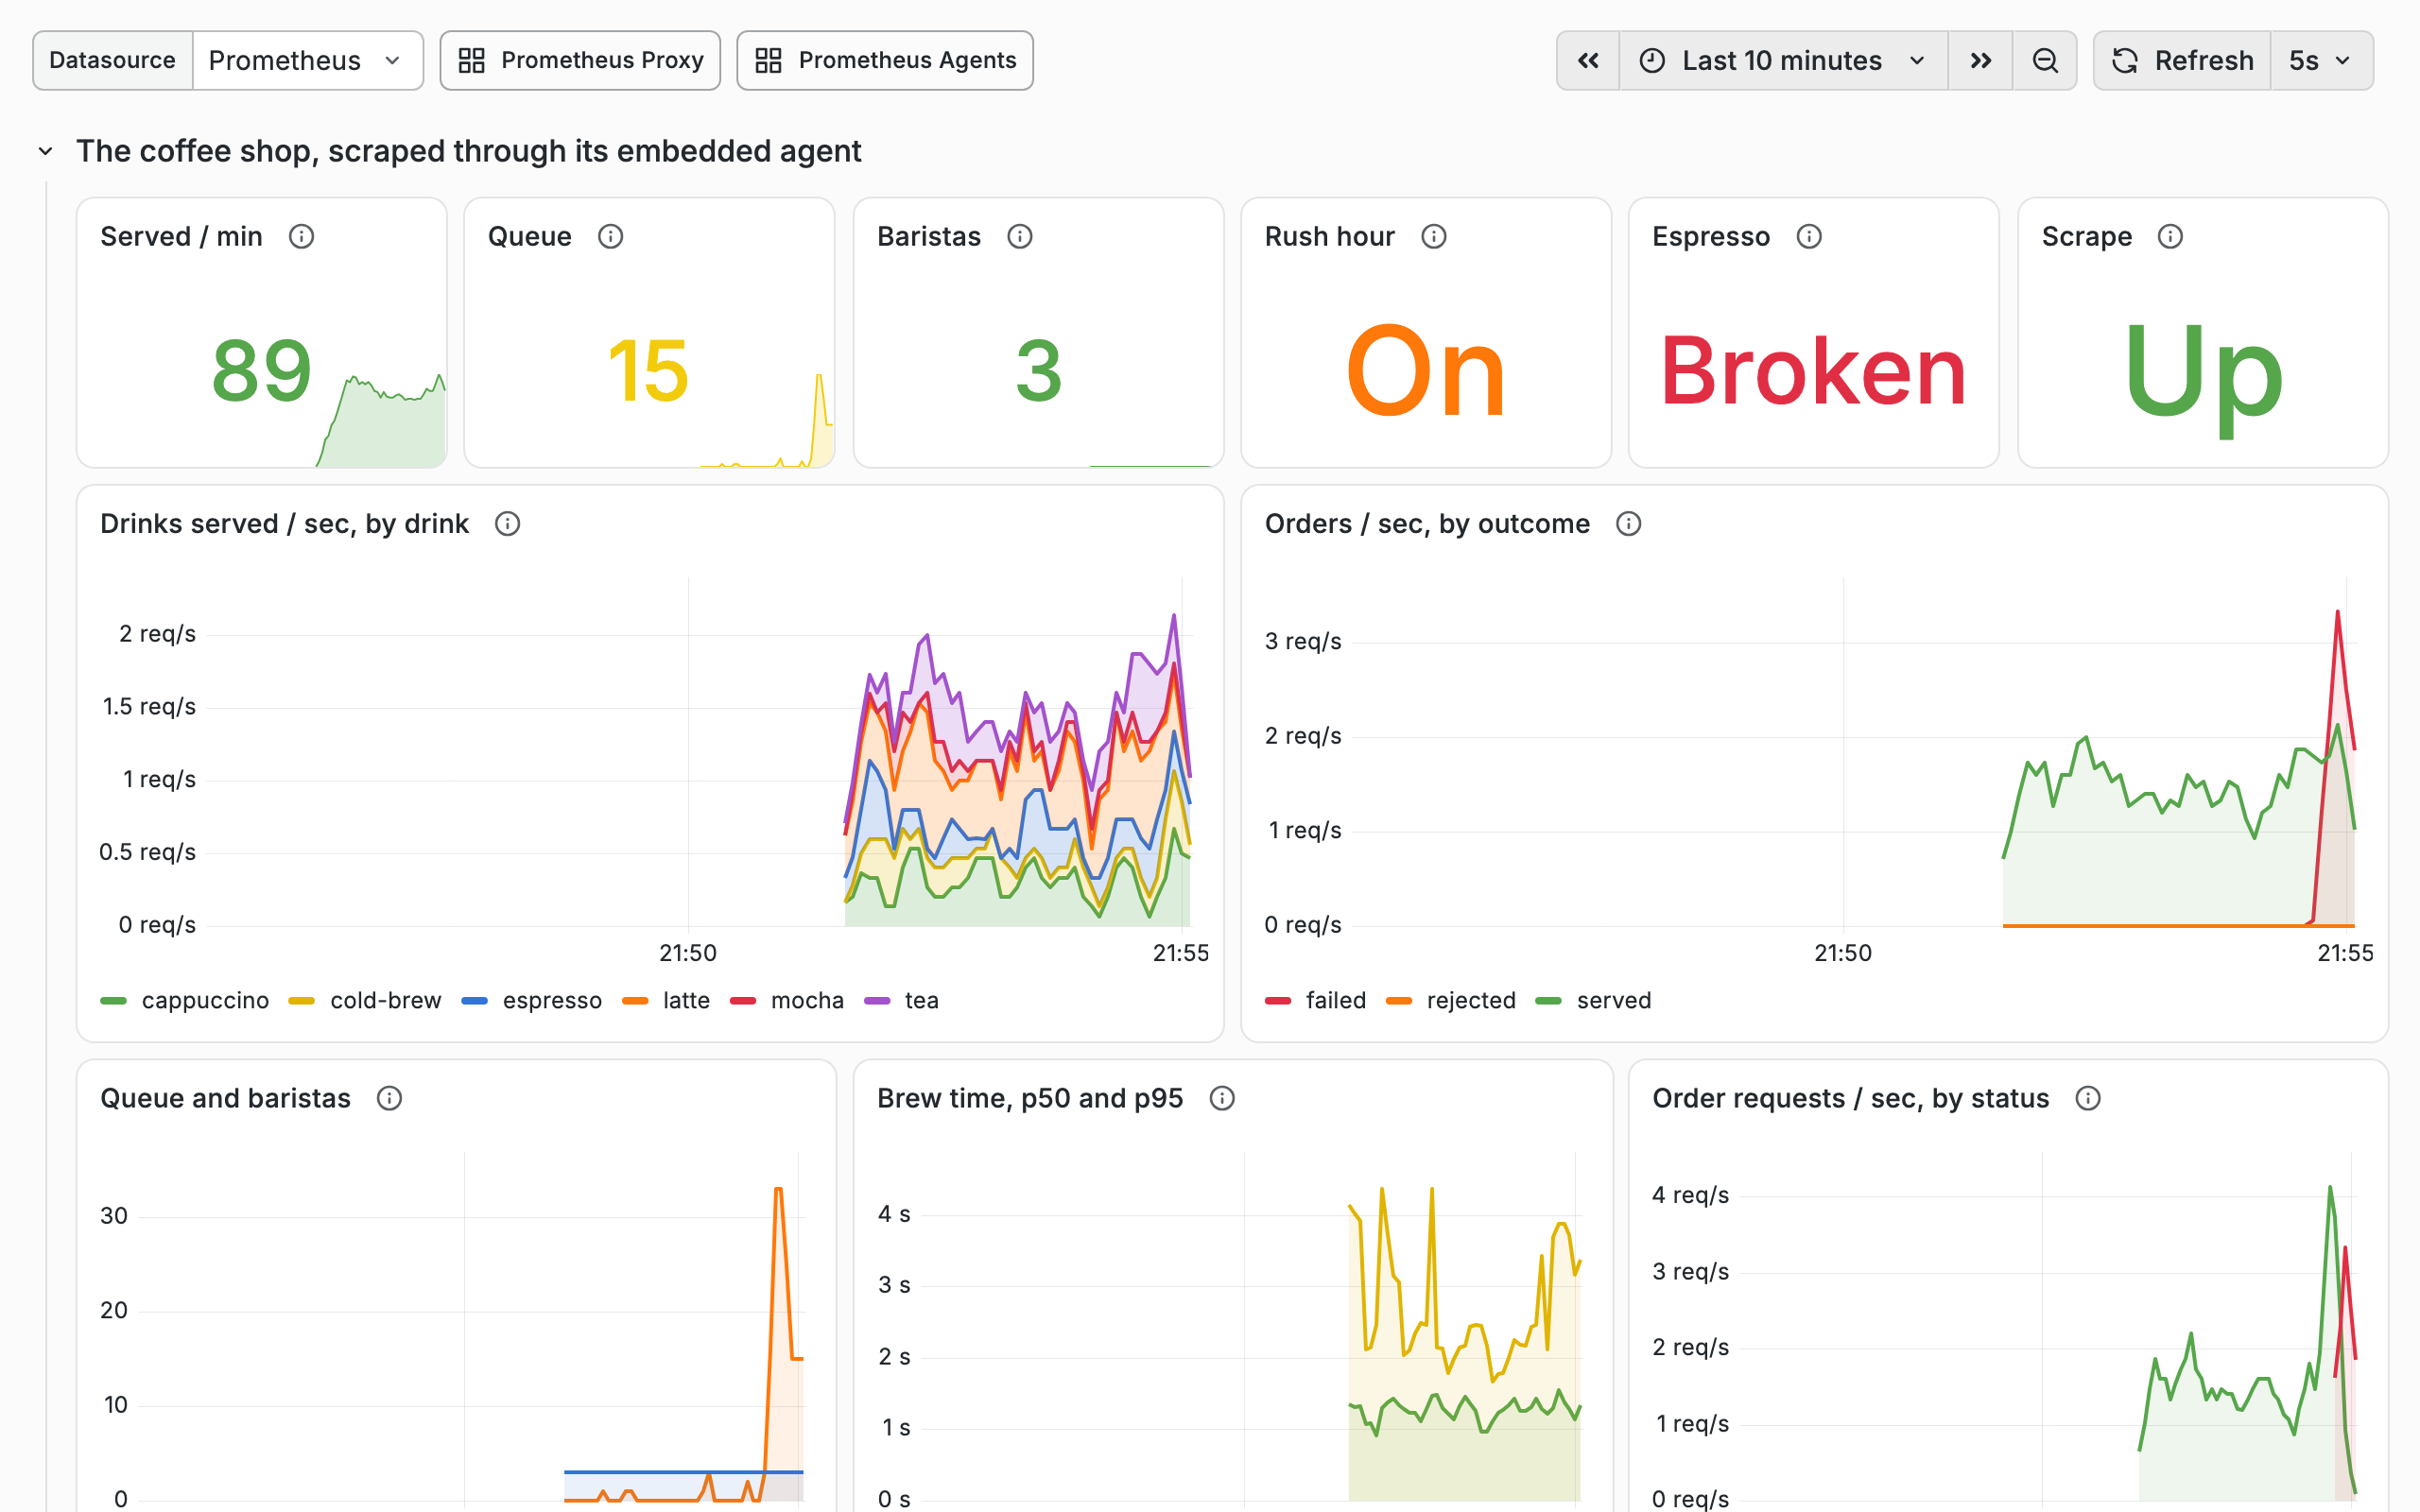
Grafana opens on the Coffee Shop dashboard: the shop right now, drinks served by type, orders by outcome, the queue
against the baristas, brew time, the order counter's HTTP statuses, and, below them, Ktor's HTTP latency, the JVM's
heap, and how long each scrape through the proxy took. Here a rush has filled the queue, and with the espresso machine
broken, about three orders in four fail, and CoffeeShopErrors fires.
./demo.sh rush            # customers order three times as often
./demo.sh baristas 8      # more baristas drain the queue
./demo.sh calm            # ends the rush
./demo.sh break-machine   # every espresso drink fails
./demo.sh fix-machine
A deploy
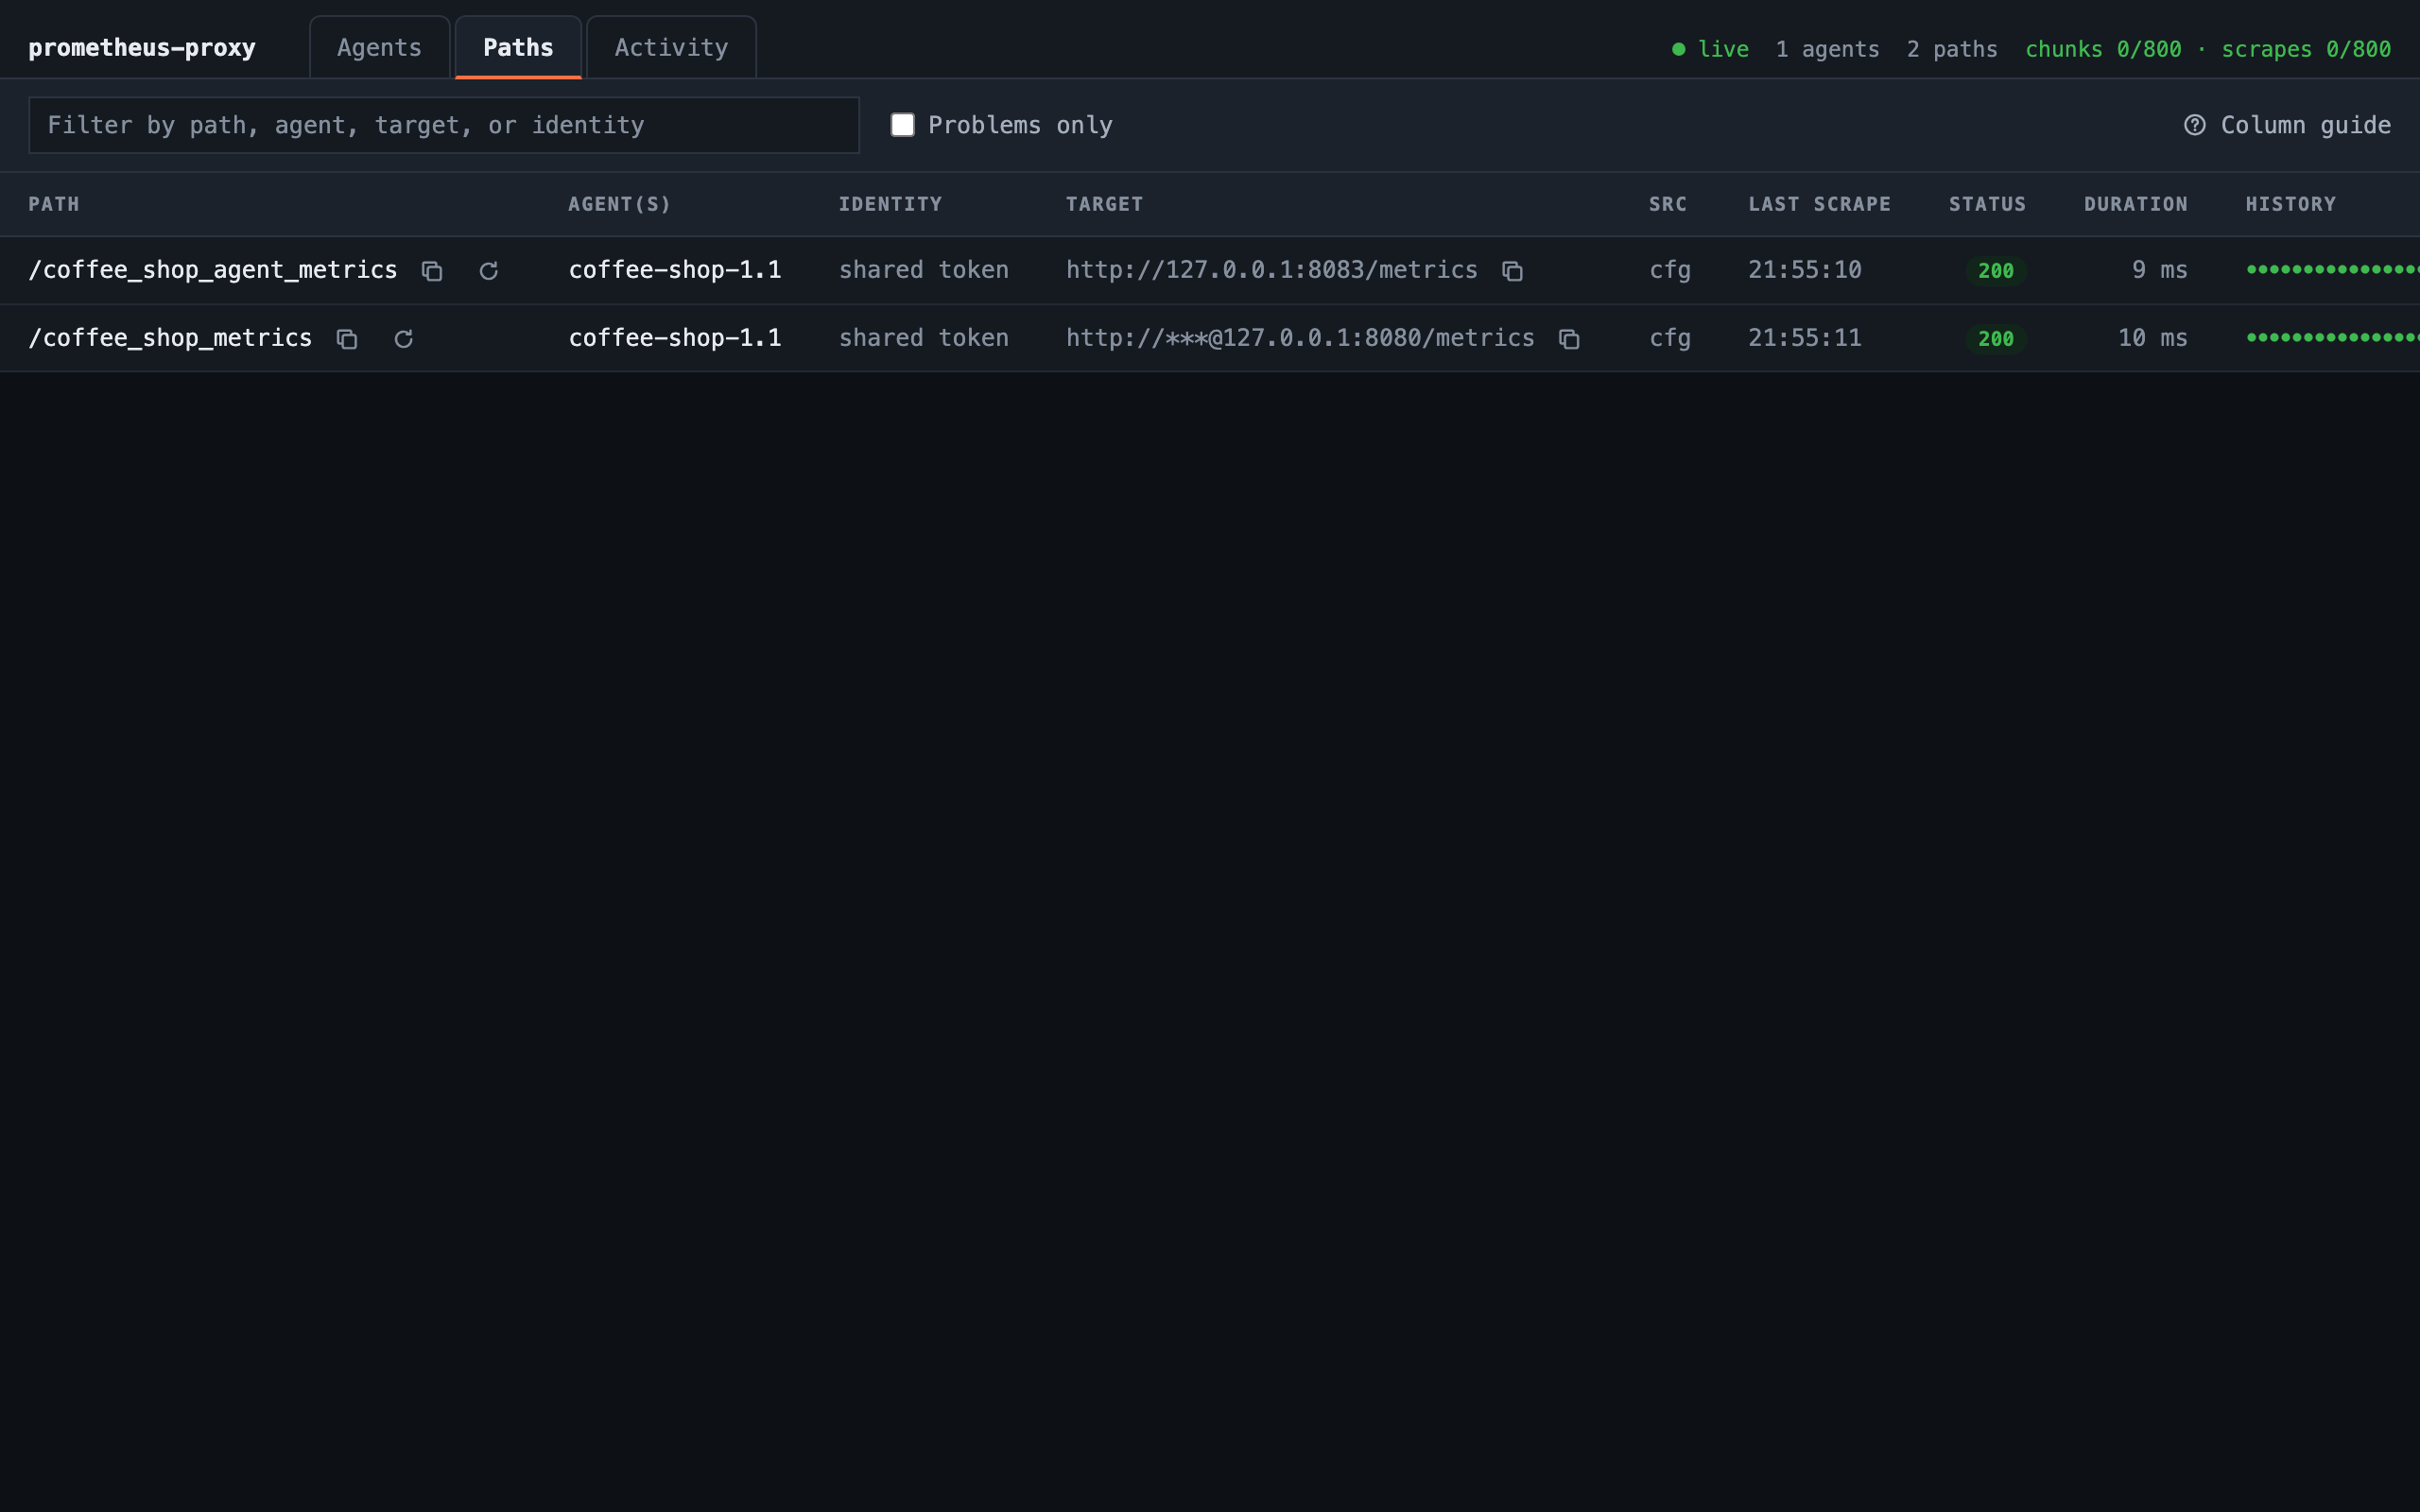
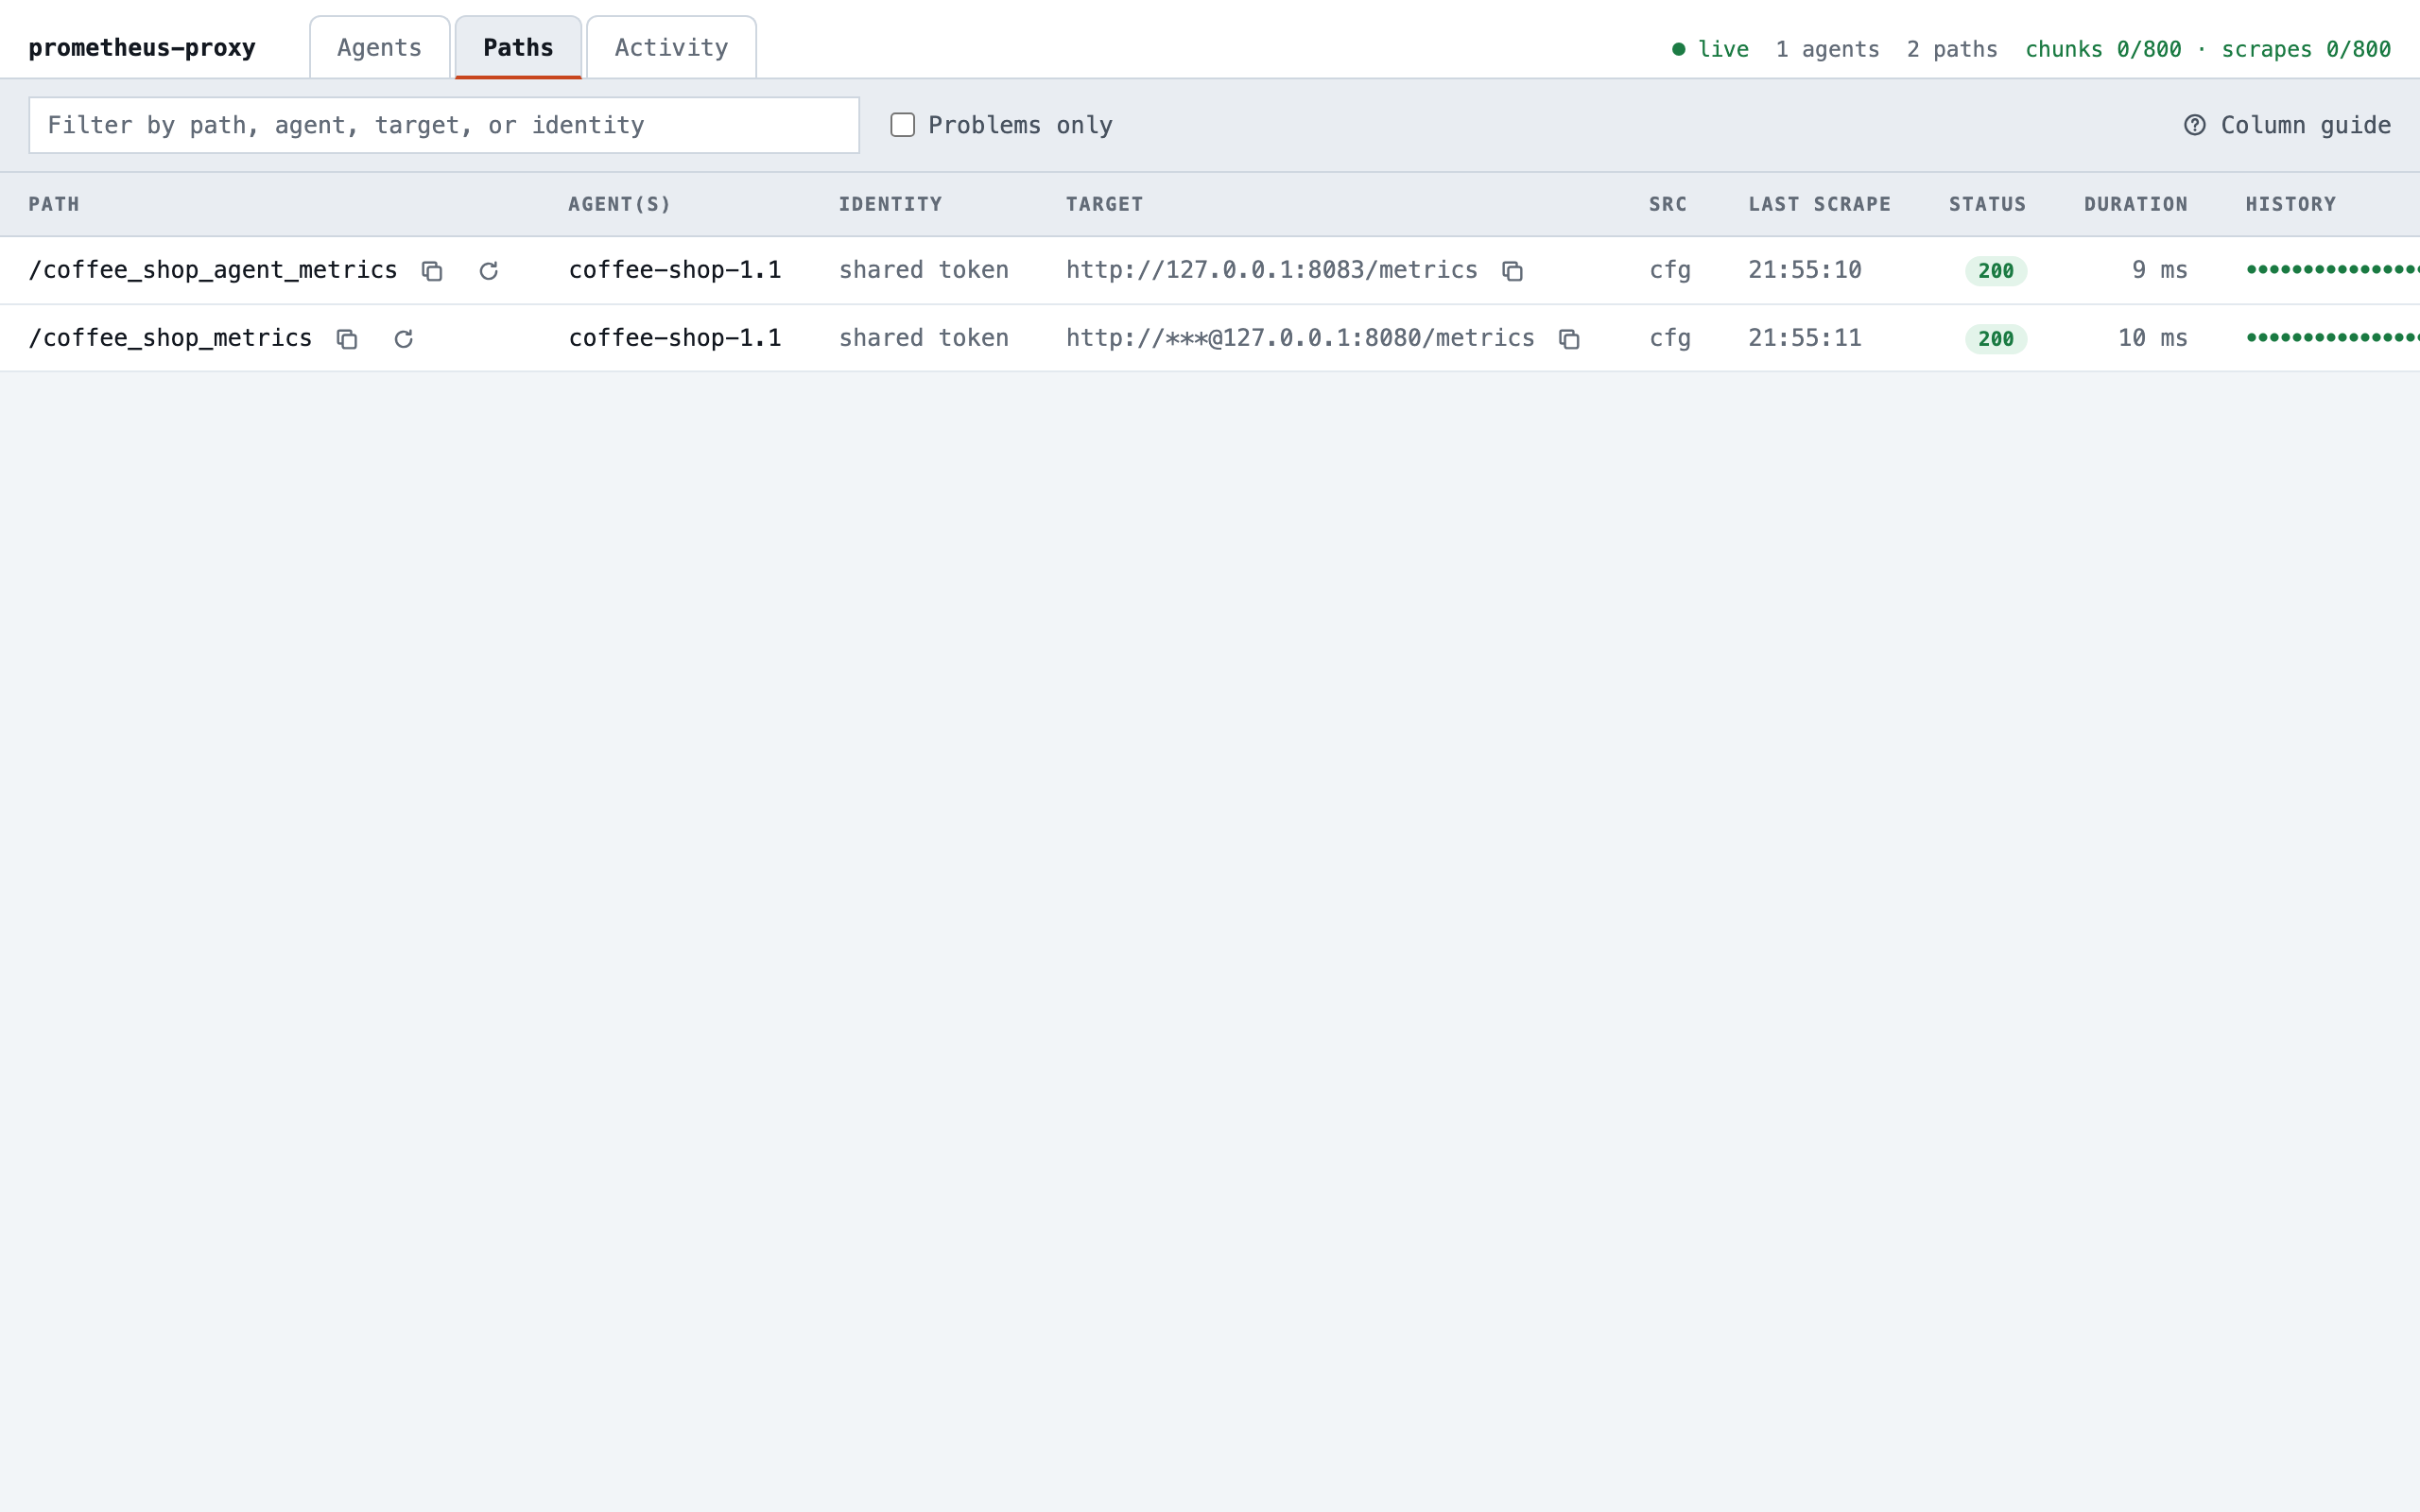
./demo.sh deploy starts version 1.1 beside 1.0, then stops 1.0, as a rolling deploy does. 1.1's agent registers the
same paths with the same token, and the proxy gives each one to the newer registration, so Prometheus scrapes 1.0
through 1.0's agent, then 1.1 through 1.1's, with no gap in the graphs. The coffee shop keeps one address throughout:
its load balancer sends requests to 1.0 while it runs, and to 1.1 once it has stopped, so the status page at
http://localhost:8390 now reads Version 1.1. ./demo.sh rollback puts 1.0 back.
The proxy goes away
./demo.sh proxy-stop stops the proxy. The coffee shop keeps serving, and an order still goes through
(./demo.sh order), since its agent retries in the background and the app never waits on it. Prometheus can't reach
the proxy, so the graphs stop and CoffeeShopDown fires. ./demo.sh proxy-start brings it back, and the agent
reconnects within a few seconds and registers its paths again.
Secrets from the environment
./demo.sh secrets lists the coffee shop's and the proxy's secrets by name, and shows that the app's container holds
no config file. The app builds its agent's settings in code from its environment, and the stock proxy image, which has
no shell to write a variable to a file, takes its certificate and key as base64 PEM in CERT_CHAIN_PEM and
PRIVATE_KEY_PEM, and logs only whether each is set. On a cloud platform, they're the service's variables.
Scenario reference
| Command | Effect |
|---|---|
demo.sh peek |
Tries /metrics without the password, then reads it through the proxy |
demo.sh order [drink] |
Orders a drink at the counter (default latte) |
demo.sh rush / calm |
Starts a rush, or ends it and keeps three baristas |
demo.sh baristas <count> |
Puts this many baristas on shift, from 1 to 12 |
demo.sh break-machine / fix-machine |
Every espresso drink fails, or is served again |
demo.sh deploy / rollback |
Deploys version 1.1 beside 1.0 and stops 1.0, or puts 1.0 back |
demo.sh proxy-stop / proxy-start |
Stops or starts the proxy |
demo.sh secrets |
Shows where the secrets come from |
make tour [PART=n] |
Walks through every scenario, from part 1 or the one given, pausing before each step |
make status |
The containers, the coffee shop's state, and the URLs |
make logs [SERVICE=name] |
Follows the logs, of every service or the one given |
make open |
Opens the coffee shop, the dashboard, Grafana, and Prometheus's alerts in the browser |
calm, fix-machine, rollback, and proxy-start undo every scenario. For a clean slate, make down && make up.
Going further
- The demo's README has these scenarios as a
guided tour, explaining how each one works, and lists the files that set the demo up. The coffee shop's code is in
demos/embedded/app. - Cloud Platforms sets the same thing up for real: the app on ECS, Cloud Run, or Azure Container Apps, and the proxy on AWS, GCP, Azure, DigitalOcean, or Railway, with your own certificate and token.
- Embedded Agent covers the API the coffee shop uses, and the agent's logging and metrics inside a host app.
- The Spring Boot Demo embeds the agent in a Spring Boot app written in Java, and shows the agent's lifecycle with the app's, Actuator's metrics behind Spring Security, and the versions Spring Boot picks.
- The Basics Demo runs standalone agents behind a simulated firewall, with the proxy's dashboard.