Basics Demo
The repository ships a demo that runs the whole system on one machine: the proxy with its dashboard, three agents behind a simulated firewall, a set of simulated services, and Prometheus and Grafana in front. It is the quickest way to watch the proxy work, and every screenshot on this page comes from it.
%%{init: {'flowchart': {'curve': 'linear'}}}%%
graph LR
  G[Grafana :3000] --> P[Prometheus :9090]
  P -->|discovery and scrapes| Proxy[Proxy, dashboard :8094]
  %% Each agent connects out to the proxy, so its arrow points back. The invisible links keep the agents to
  %% the right of the proxy, as on the home page.
  Proxy ~~~ East
  Proxy ~~~ West1
  Proxy ~~~ West2
  East[agent-east] -->|gRPC| Proxy
  West1[agent-west-1] -->|gRPC| Proxy
  West2[agent-west-2] -->|gRPC| Proxy
  East -->|HTTP fetch| App[demo-app: simulated services]
  West1 -->|HTTP fetch| App
  West2 -->|HTTP fetch| App

  subgraph Outside Firewall
    G
    P
    Proxy
  end

  subgraph Inside Firewall
    East
    West1
    West2
    App
  end
What you need
The proxy and agent are the latest release's images, from Docker Hub, so there's nothing to build. On macOS or Linux, the demo needs only:
- Docker with Compose v2: Docker Desktop, or Docker Engine with the Compose plugin.
git, to clone the repository, and GNUmake. On macOS, the Xcode command-line tools (xcode-select --install) have both. Where GNU make is installed asgmake, typegmakewherever these instructions saymake.curl, which the demo uses to wait for each service to answer.- A web browser.
Running it
Clone the repository at the latest release, then run the demo's commands from its own directory, where make help lists
its targets:
git clone -c advice.detachedHead=false --depth 1 --branch 4.6.0 https://github.com/pambrose/prometheus-proxy.git
cd prometheus-proxy/demos/basics
make up      # pulls the images, starts everything, prints the URLs
make tour    # walks through every scenario below, pausing before each step
make down    # stops it and removes its containers, network, and volume
The first make up pulls the proxy, agent, Prometheus, Grafana, and Python images, which takes a few minutes. After
that it starts in under a minute, and runs without a network connection.
| What | URL |
|---|---|
| Proxy dashboard | http://localhost:8094/dashboard |
| Grafana (no sign-in needed; admin / admin to edit) | http://localhost:3000 |
| Prometheus | http://localhost:9090 (alerts at /alerts) |
| The proxy's service discovery | http://localhost:8080/discovery |
Every port binds to 127.0.0.1 only: the dashboard has no authentication and Grafana keeps its default admin
password, which suits a laptop and nothing shared. To move a port that is already taken, set DEMO_DASHBOARD_PORT,
DEMO_GRAFANA_PORT, DEMO_PROMETHEUS_PORT, or DEMO_PROXY_PORT, for example DEMO_GRAFANA_PORT=3001 make up.
What's running
| Service | Role |
|---|---|
proxy |
The proxy, outside the firewall. Its dashboard is on, and its service discovery tells Prometheus about every path the agents register. |
agent-east |
Scrapes the orders, payments, inventory, and catalog services, the proxy's own metrics, its own, and whatever its discovery file lists. |
agent-west-1, agent-west-2 |
A redundant pair. Both run consolidated and serve /shipping_metrics, and the proxy merges their two replicas. |
agent-rogue |
Started only by demo.sh rogue-agent: a contractor's agent whose identity may register only contractor_* paths. |
agent-east-copy |
Started only by demo.sh duplicate-agent: agent-east's config, deployed a second time. |
demo-app |
The simulated services. Their traffic follows a 5-minute "day", so the graphs move. It also writes agent-east's discovery file. |
prometheus |
Scrapes every path through the proxy every 5 seconds, with no targets in its config, and loads the project's alerting rules and a few fast demo ones. |
grafana |
Opens on the demo's dashboard, which links to the two dashboards the project ships. |
The dashboard
The dashboard has three views: one organized by agent, one by path, and one of what has happened, newest first. Select any screenshot on this page to see it full size.
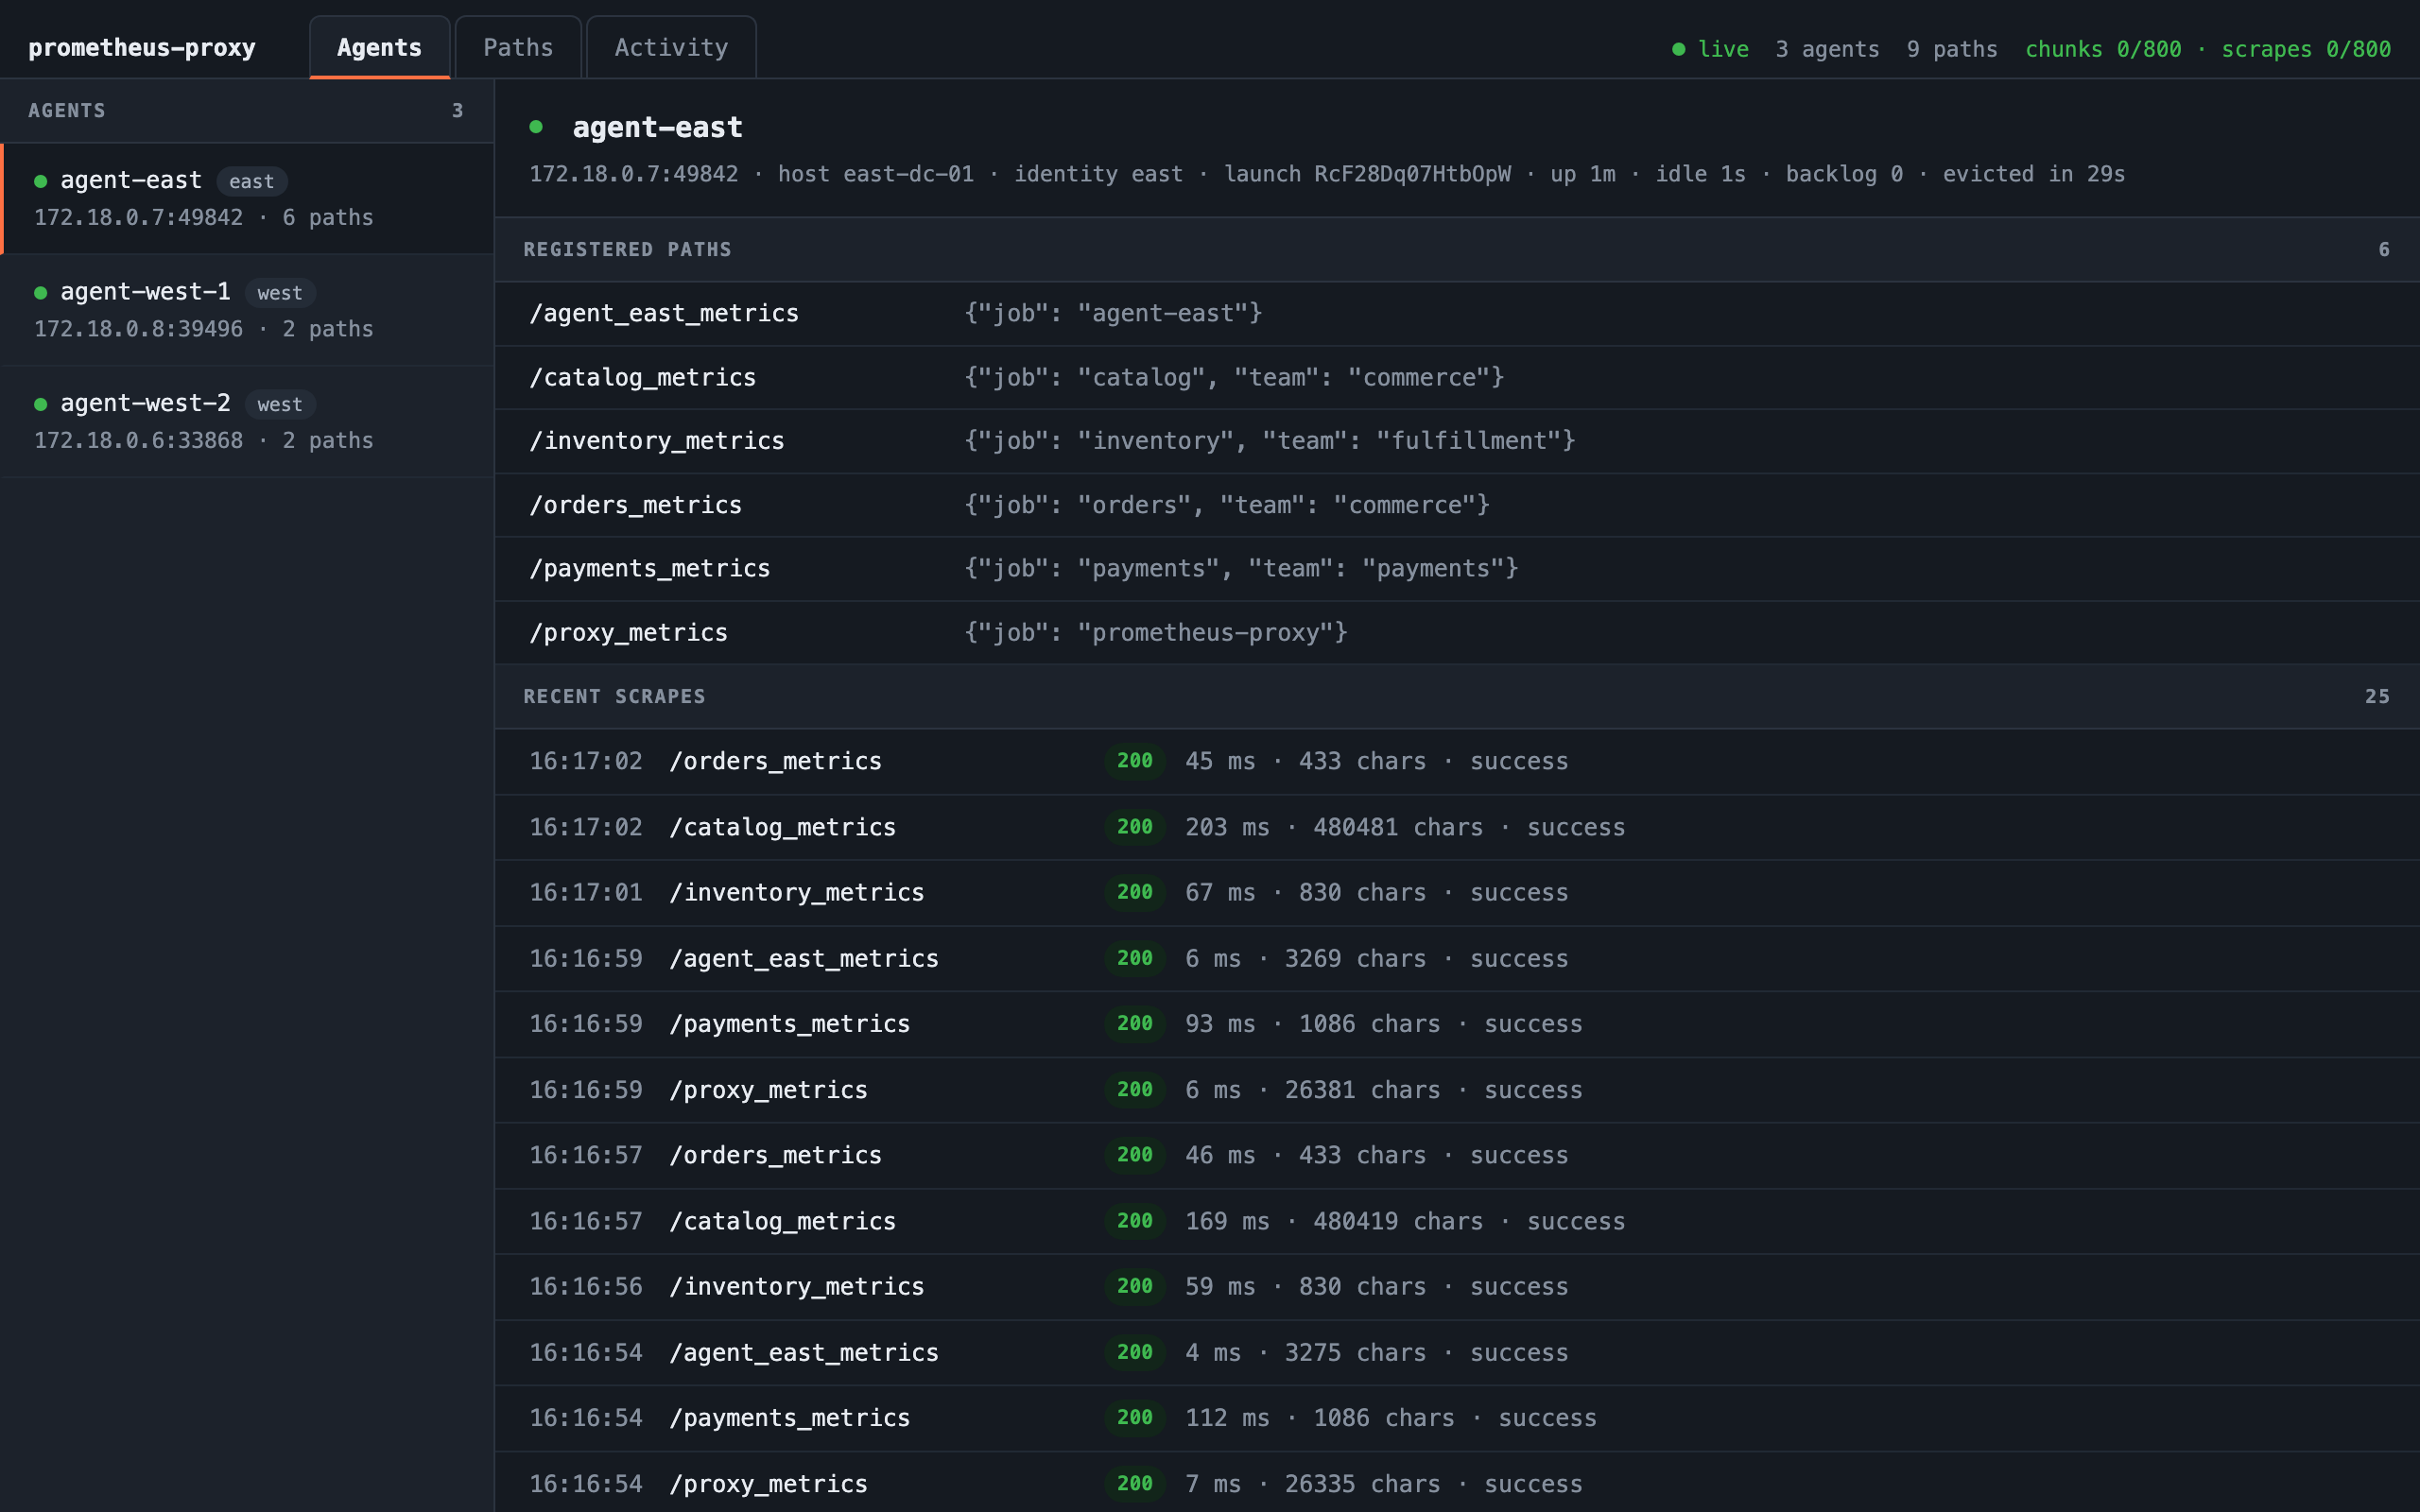
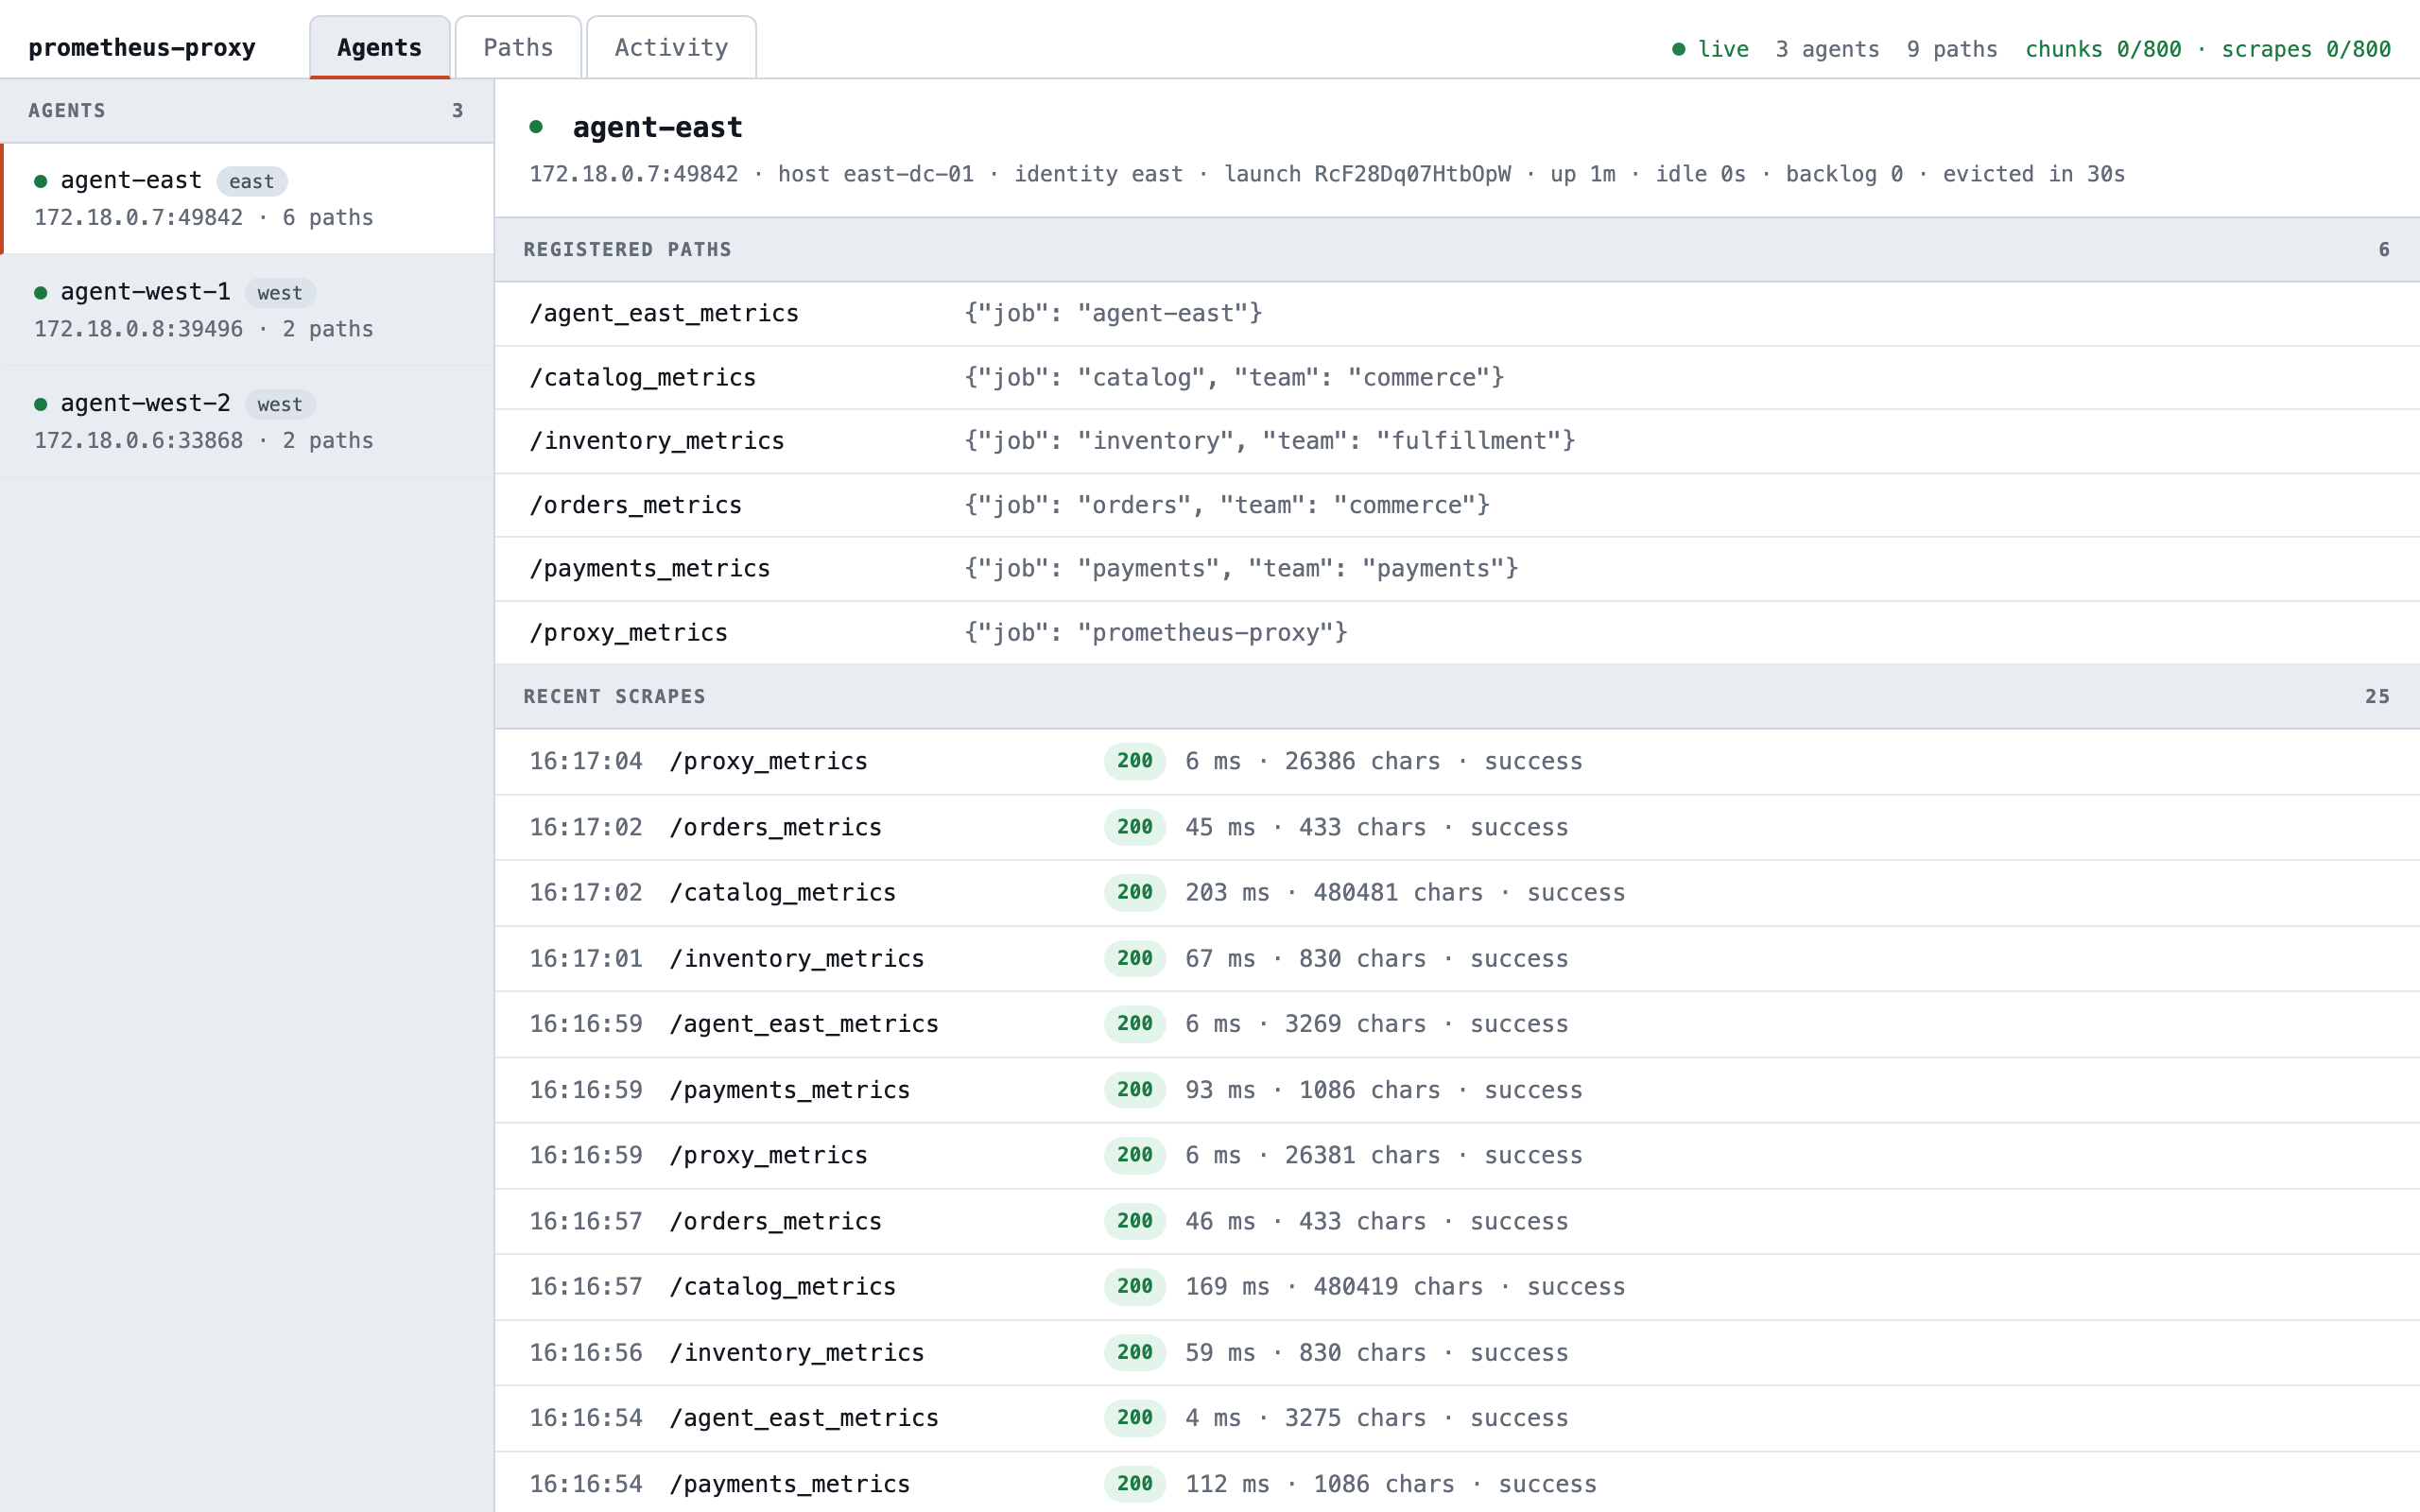
Selecting an agent shows its address, host, uptime, idle time, and eviction countdown; the paths it registered, with their labels; and its scrapes as they happen, with status, time, and size. The catalog payload is about 480,000 characters, large enough that the agent sends it to the proxy in chunks.
/proxy_metrics is the proxy's own metrics. They leave the proxy, pass through agent-east, and come back through the
proxy to Prometheus, so the proxy monitors itself the same way it serves everything else.
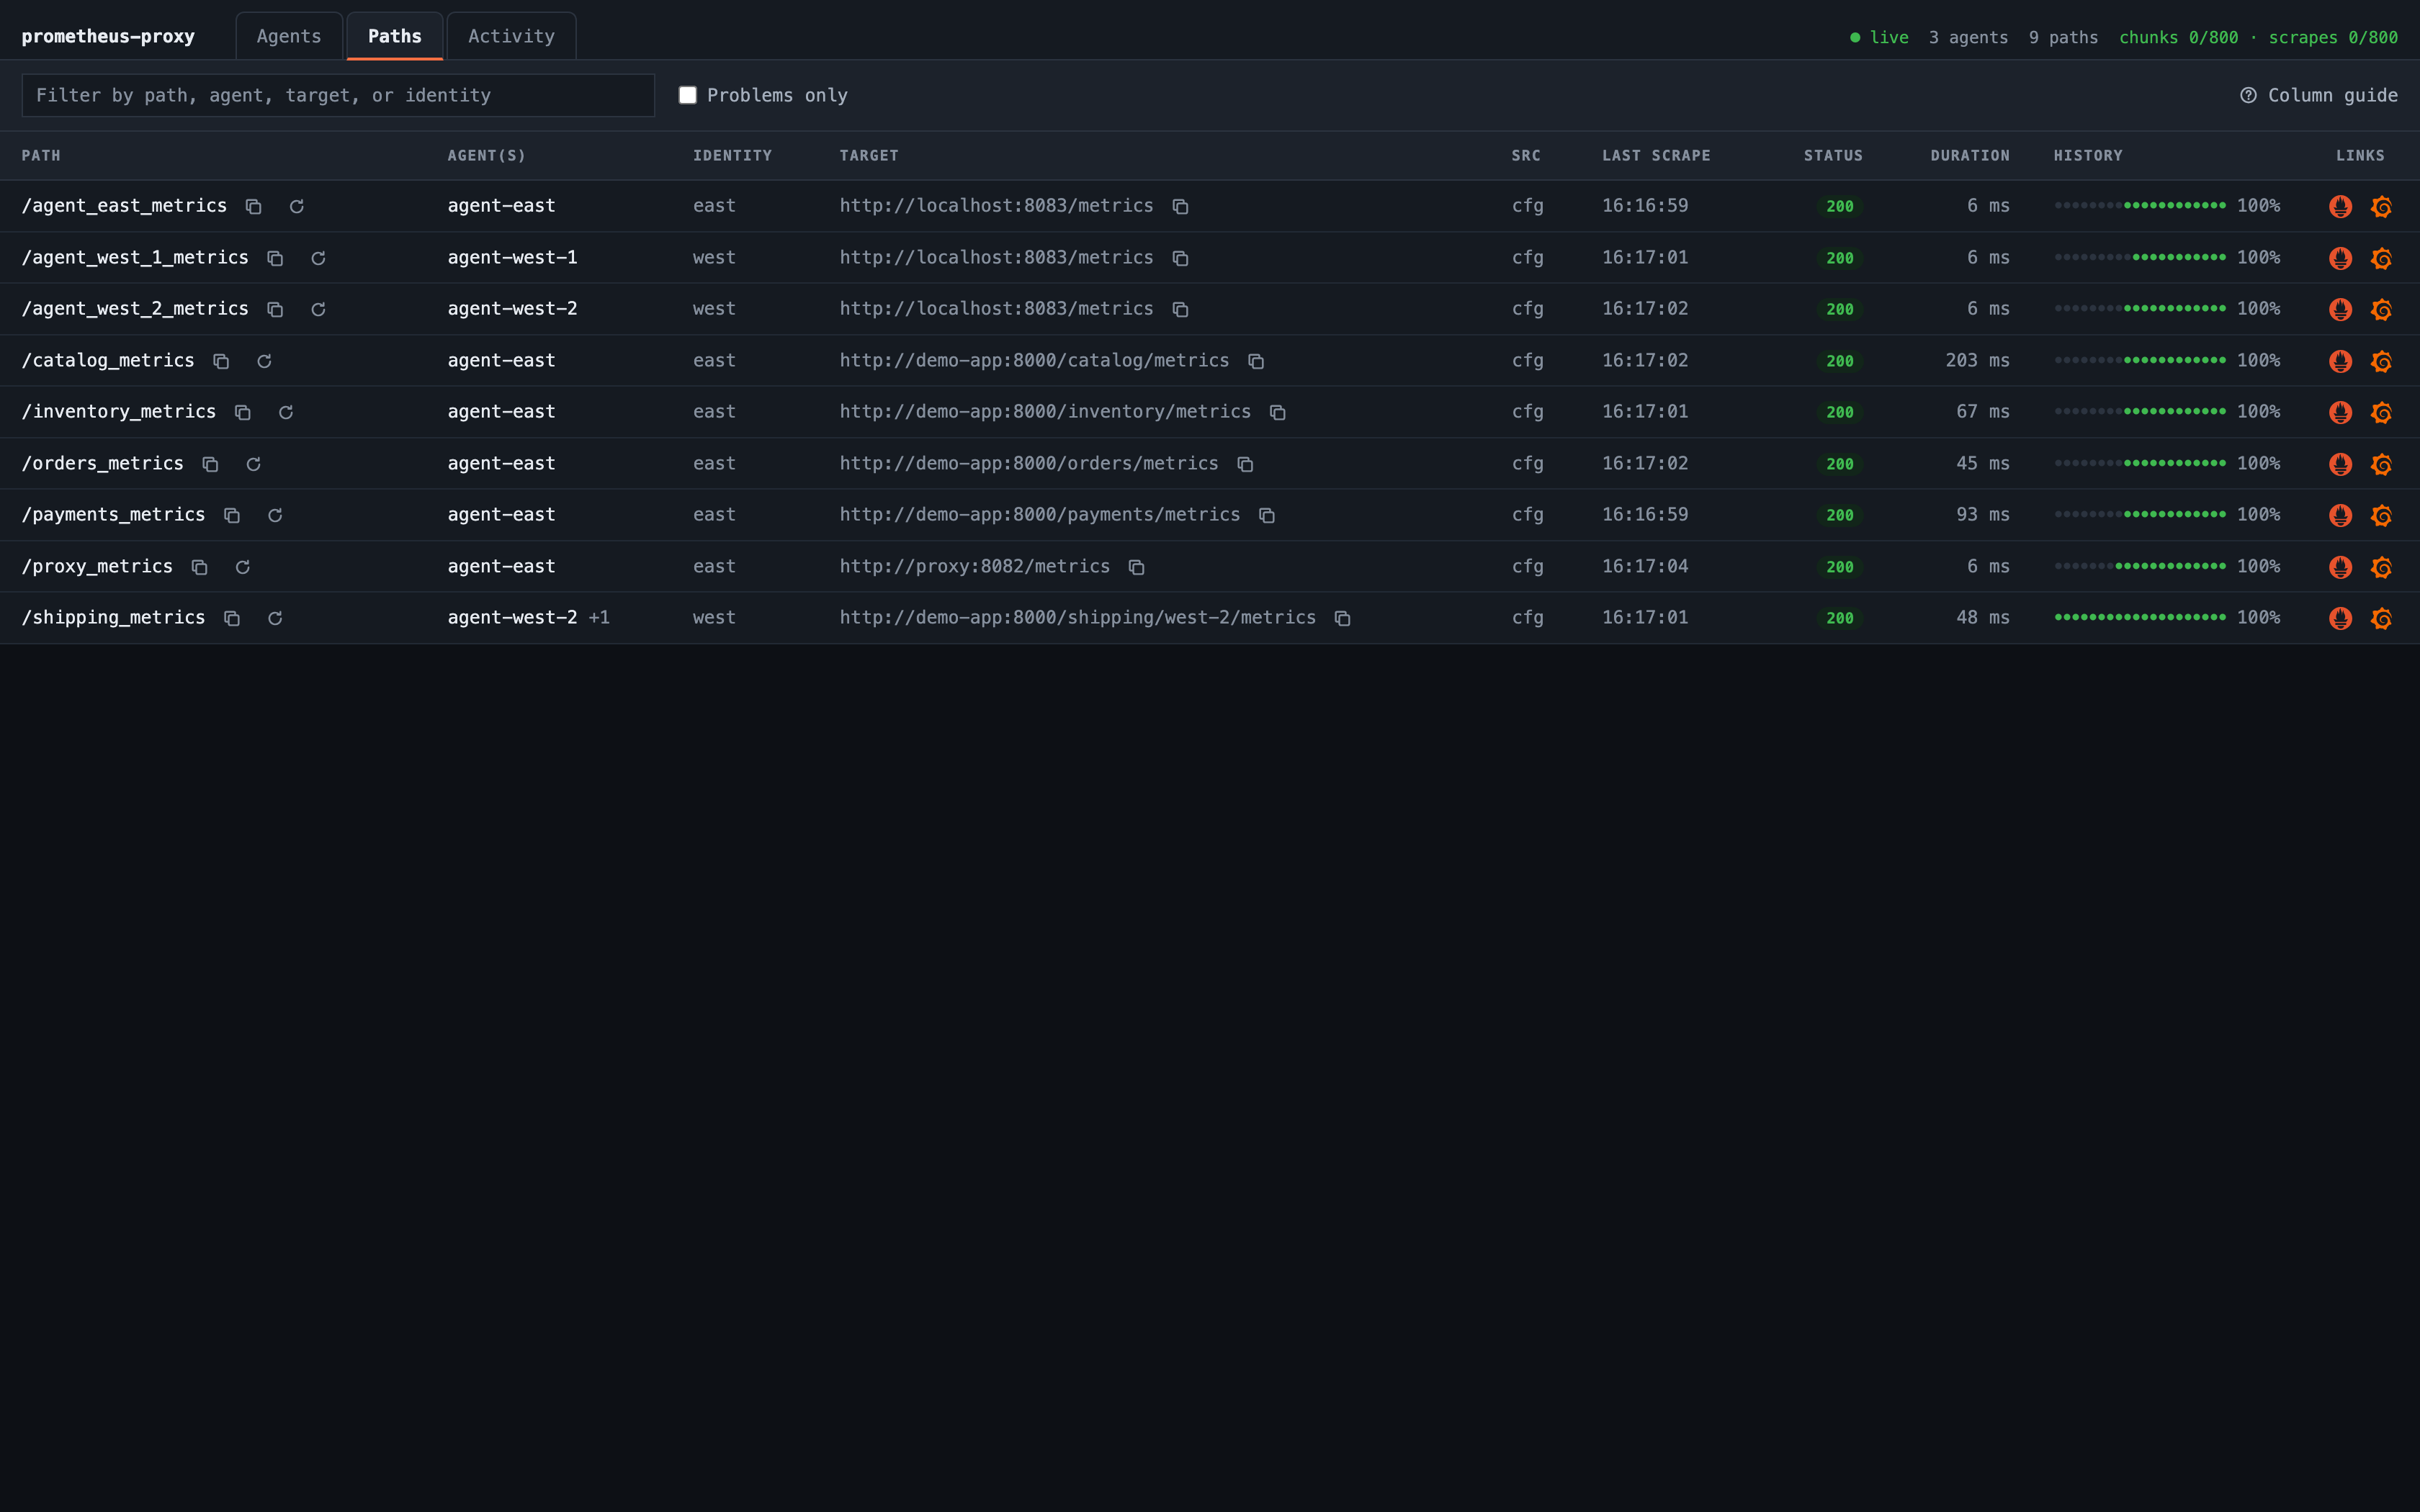
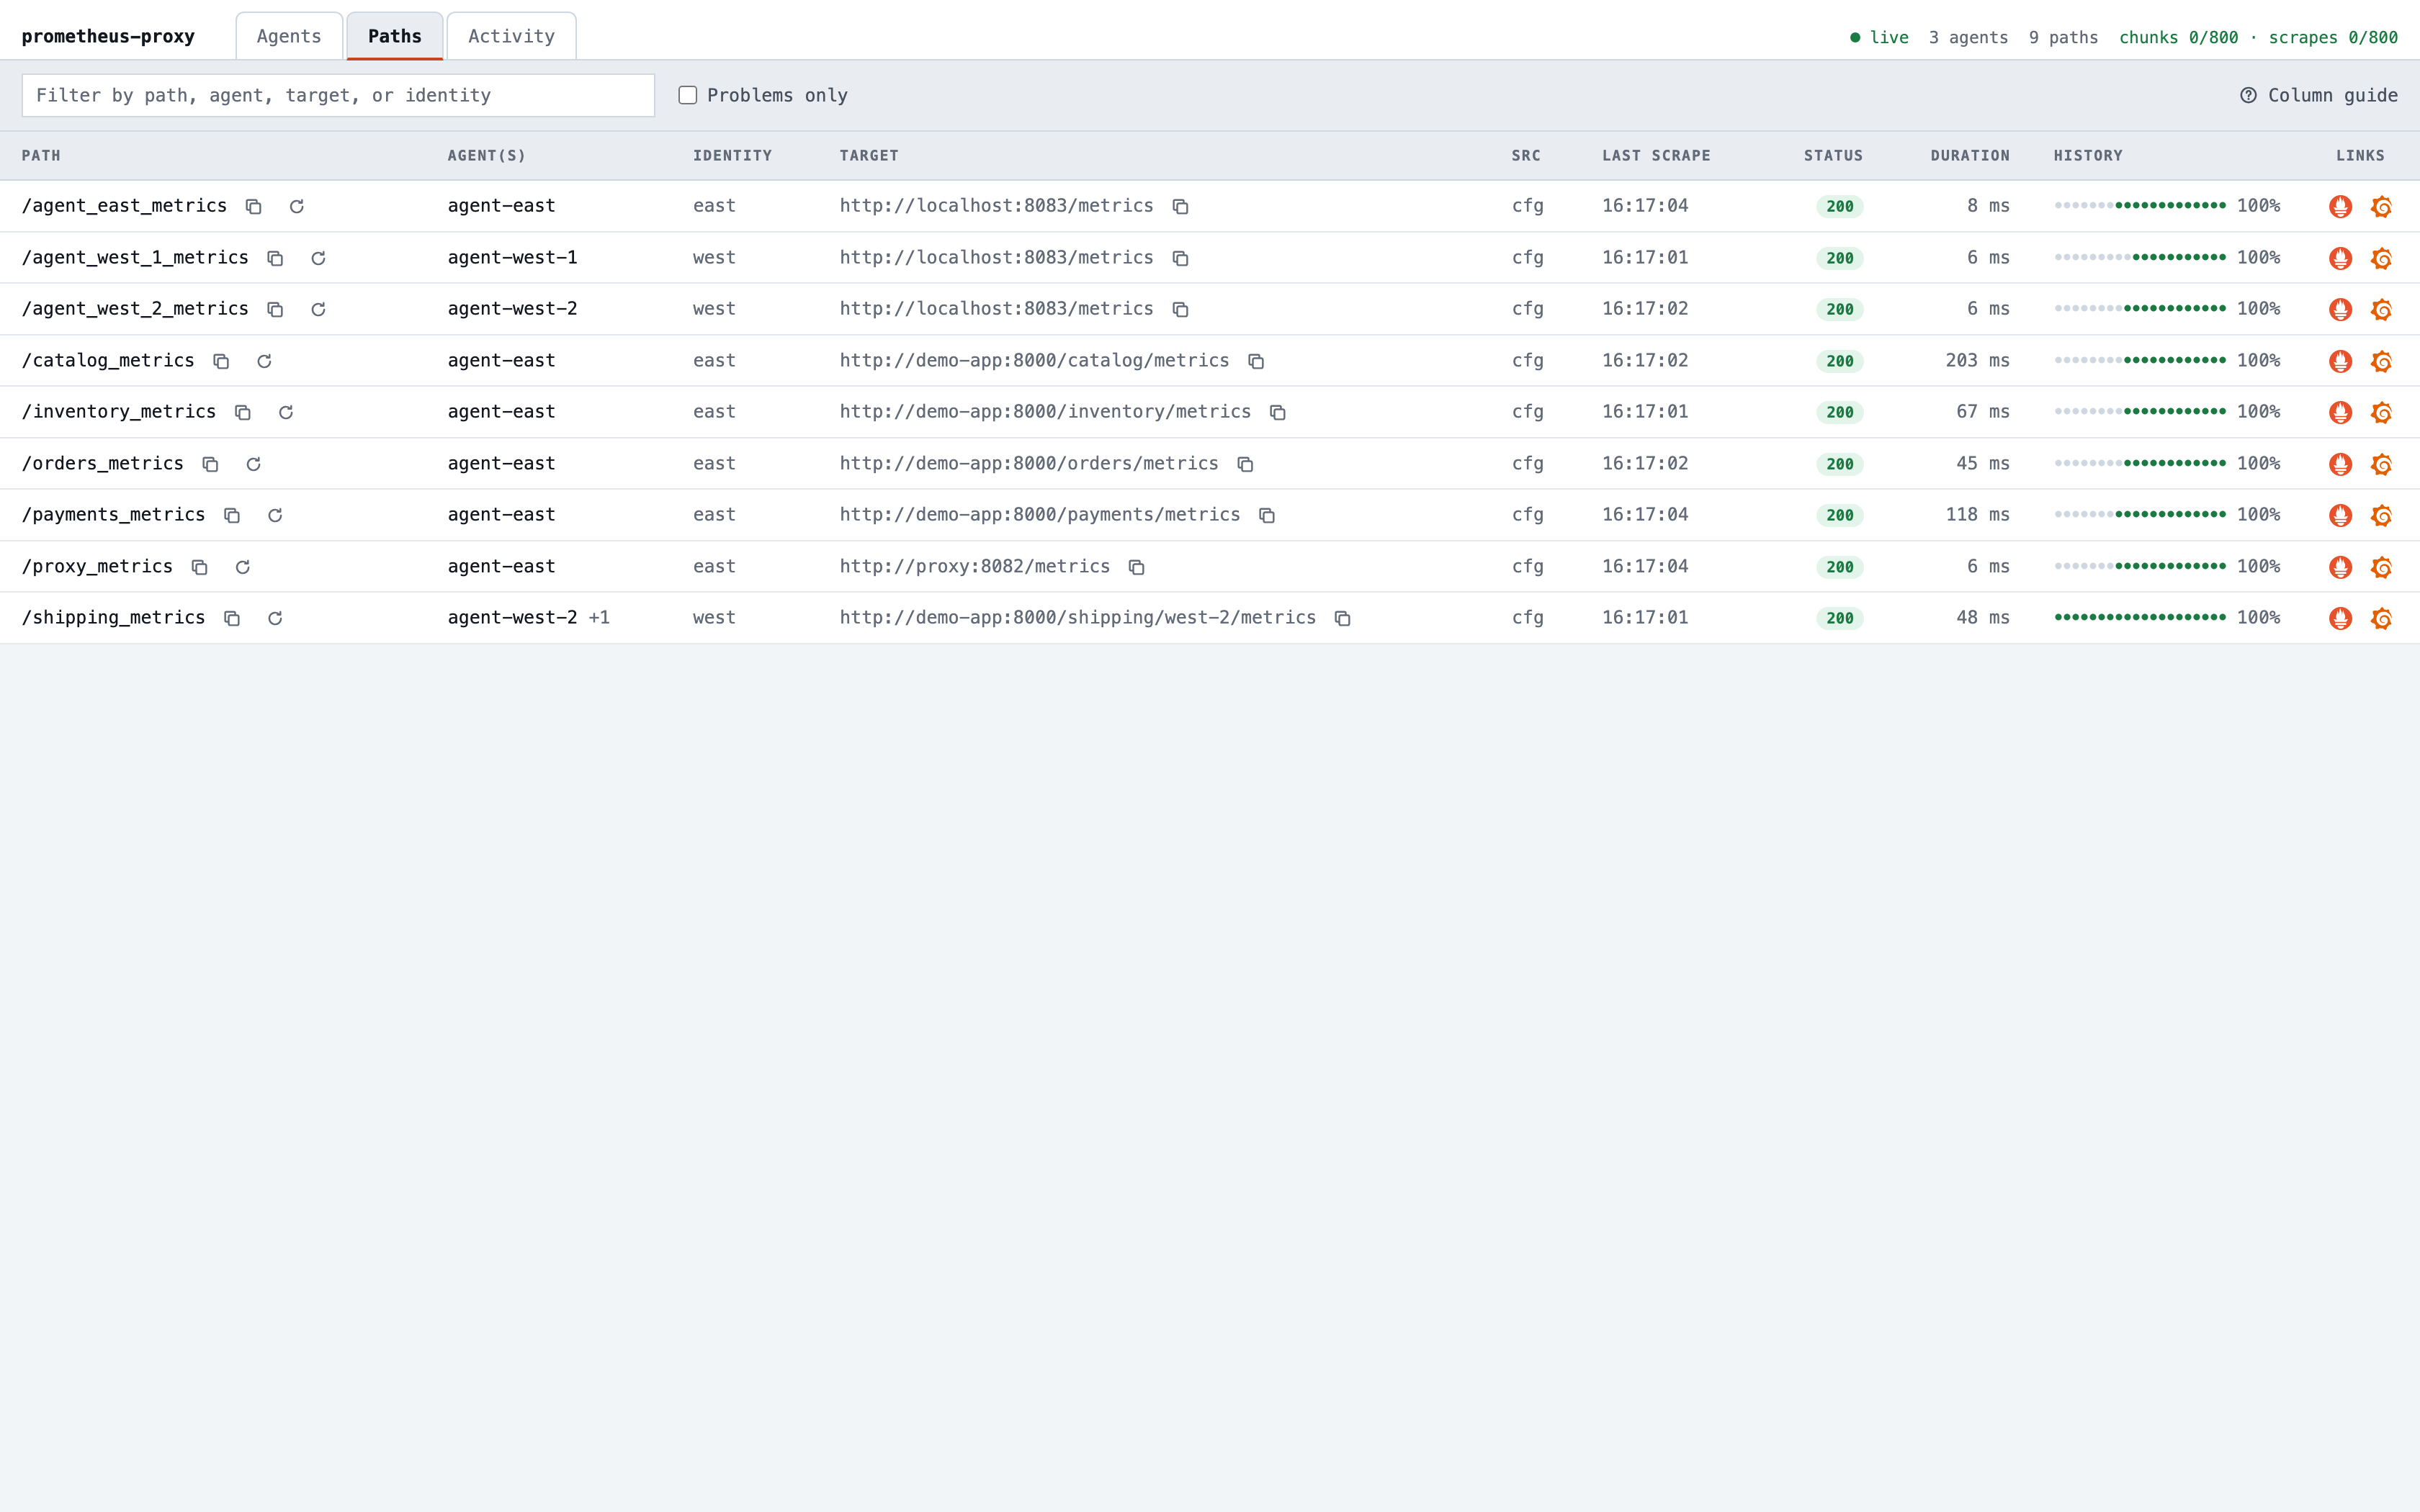
The Paths view lists every path with the agent serving it, its target, and how its last scrape went. /shipping_metrics
shows agent-west-2 +1, since two agents serve it. The button after a path copies its URL on the proxy, the one
to curl, and the one after a target copies the target's URL.
Scenarios
demo.sh, in demos/basics, drives the scenarios below. Run it from that directory, where make up started
the demo; each command prints what to watch, and a minute between them lets the graphs catch up.
One service fails, another hangs, and the rest keep working
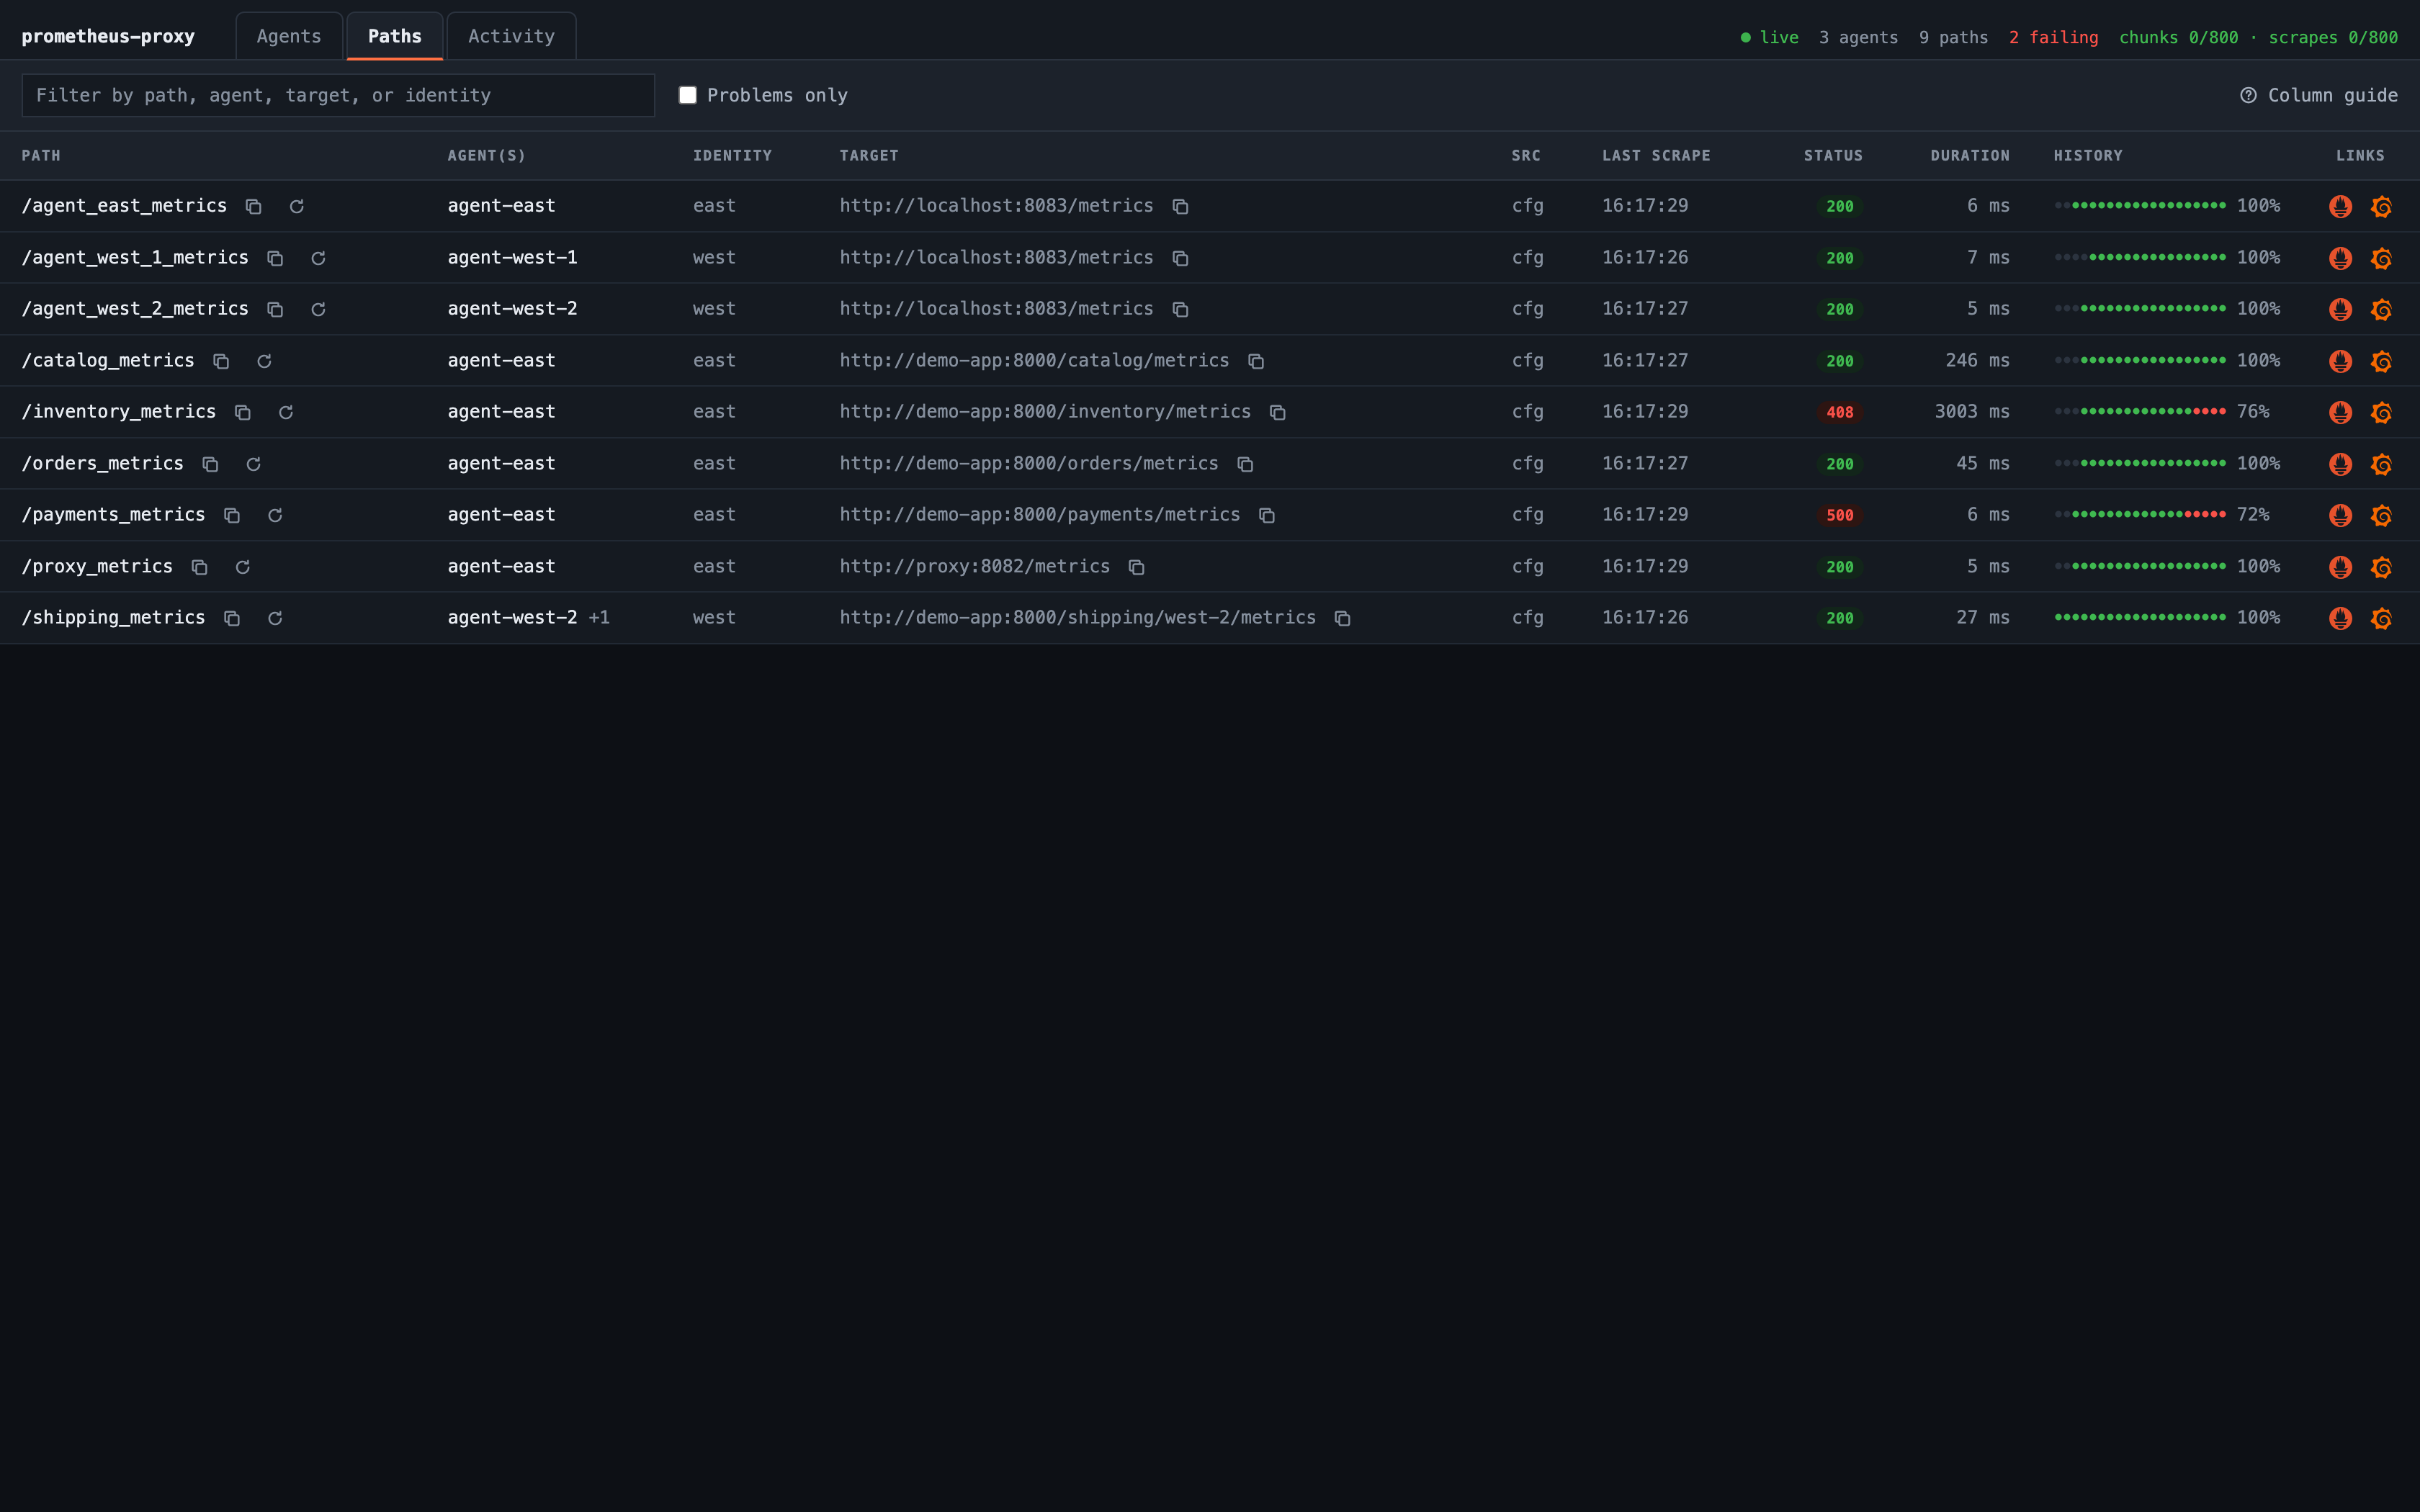
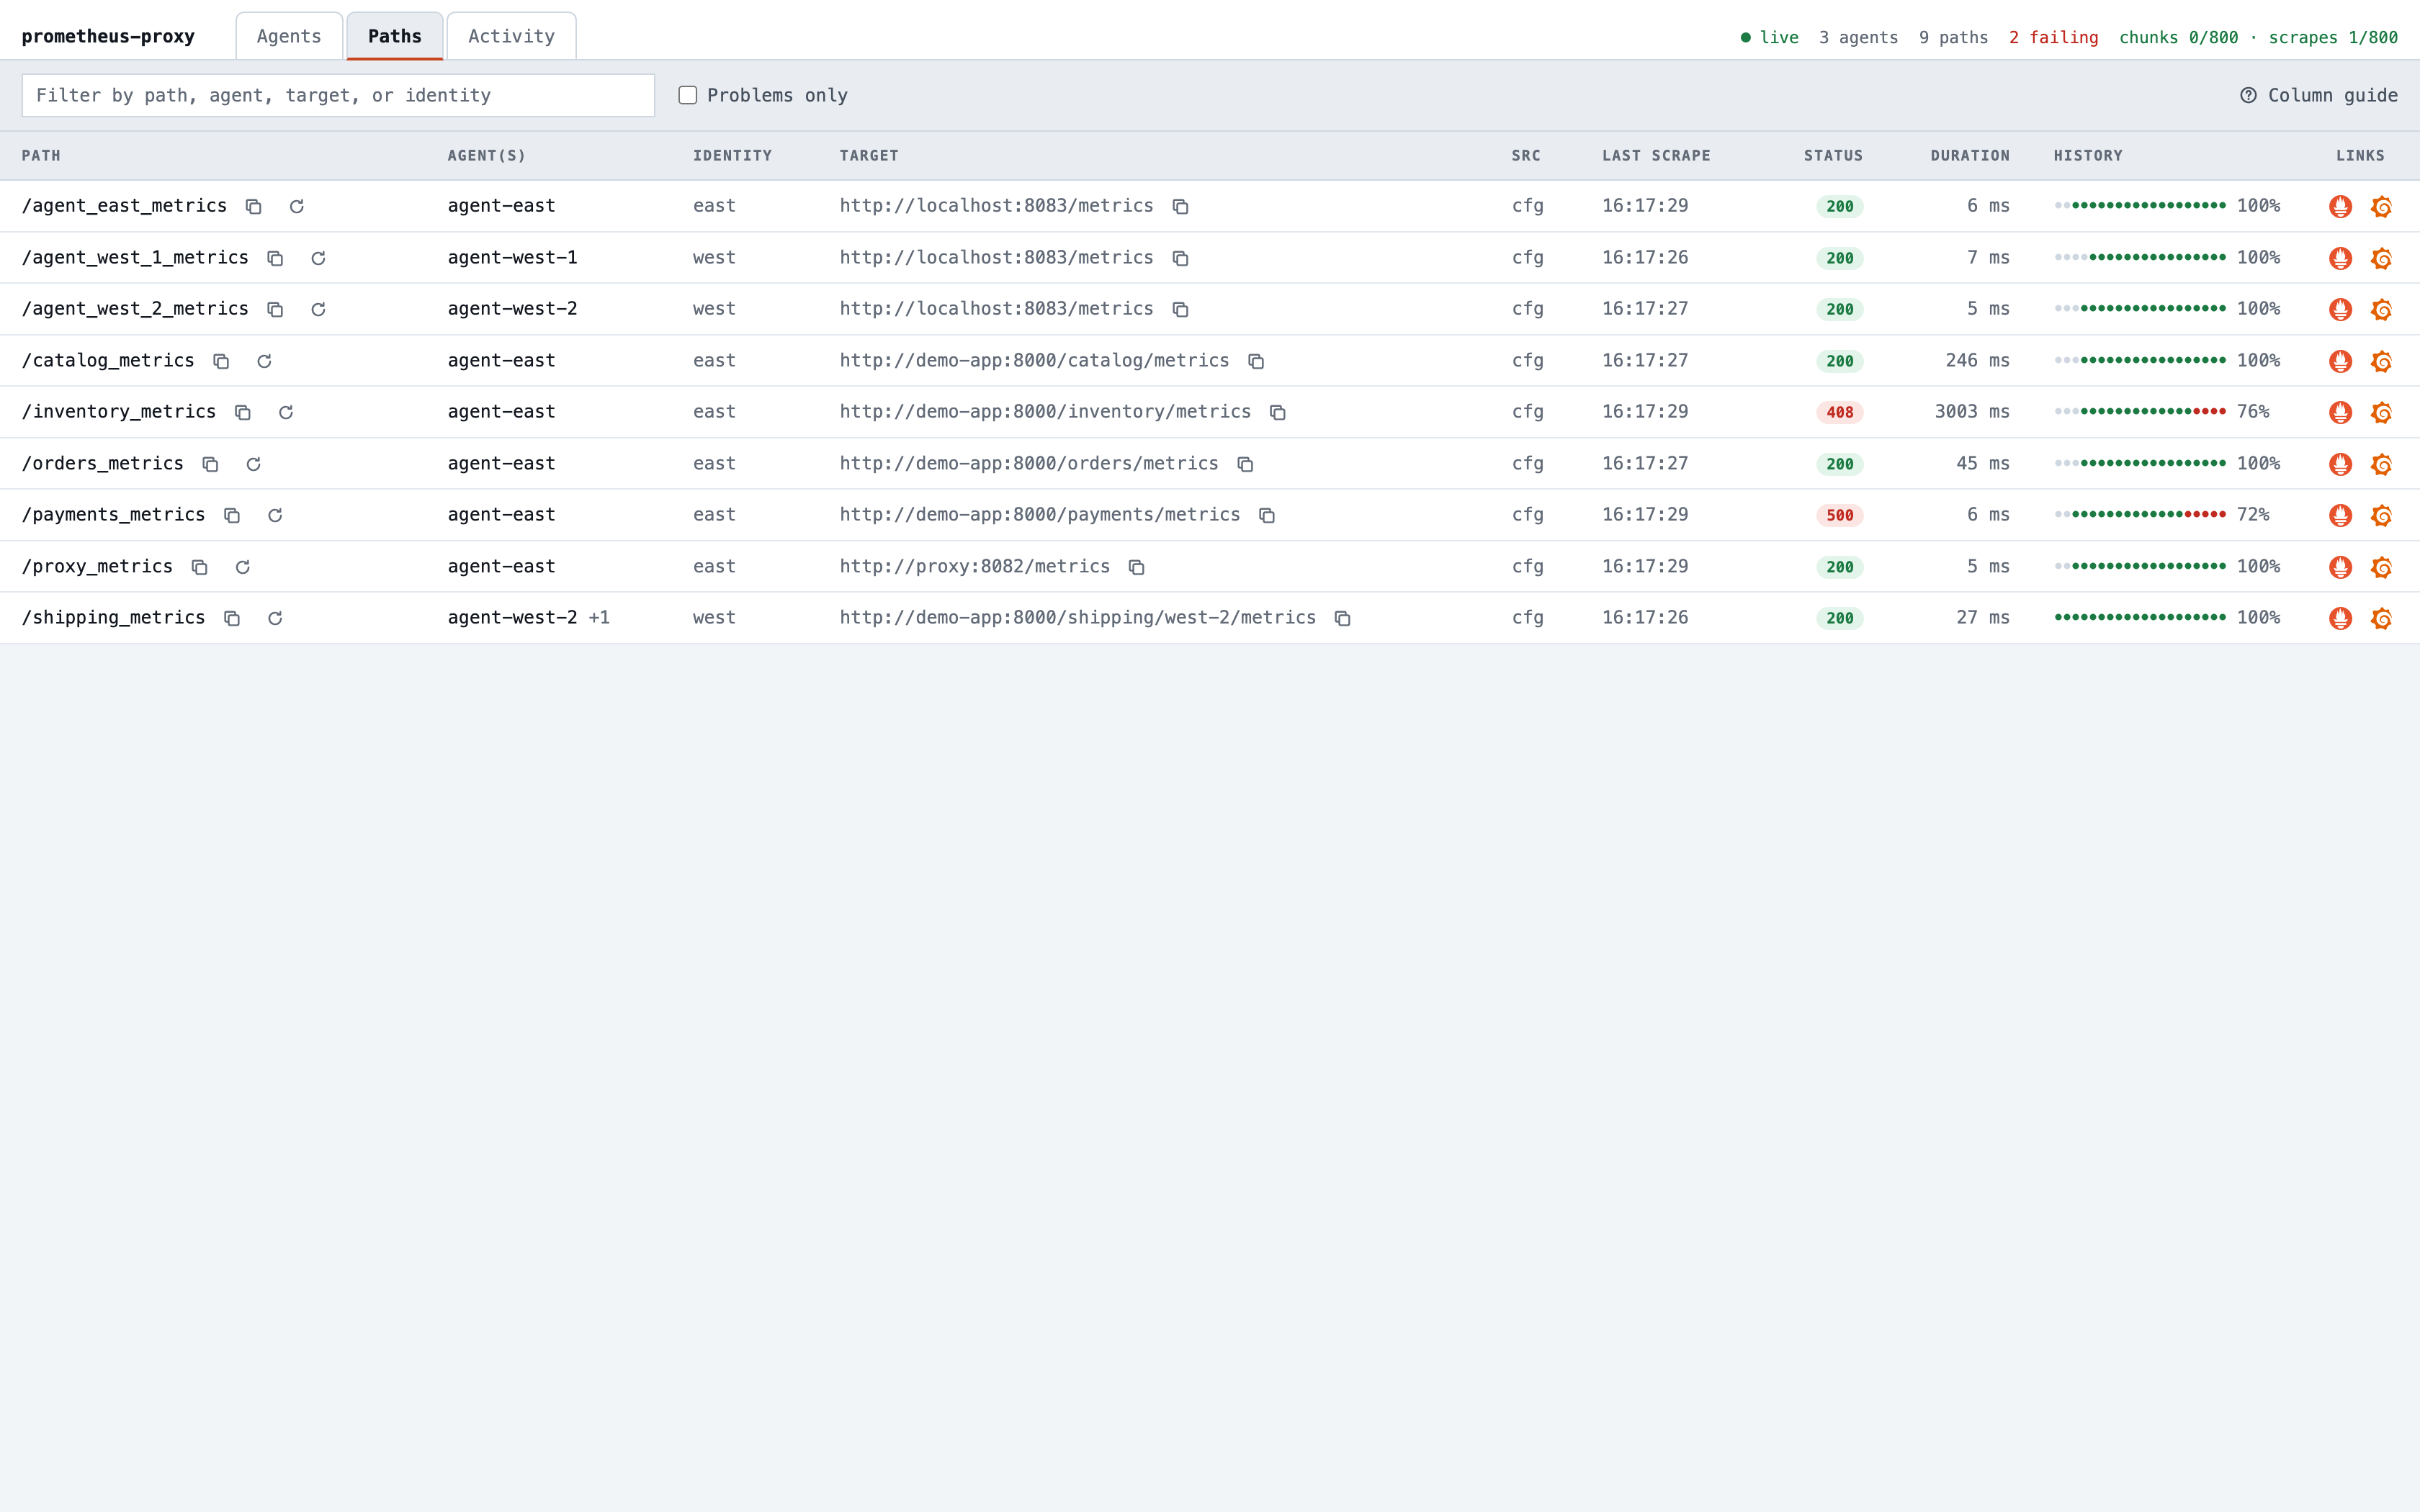
Payments' scrapes fail with a 500. Inventory's hang until the agent gives up after its 3-second scrape timeout and
reports a 408 (upstream_timed_out), so Prometheus gets a clear answer instead of waiting. Every other path keeps
working: one failing target never affects the rest.
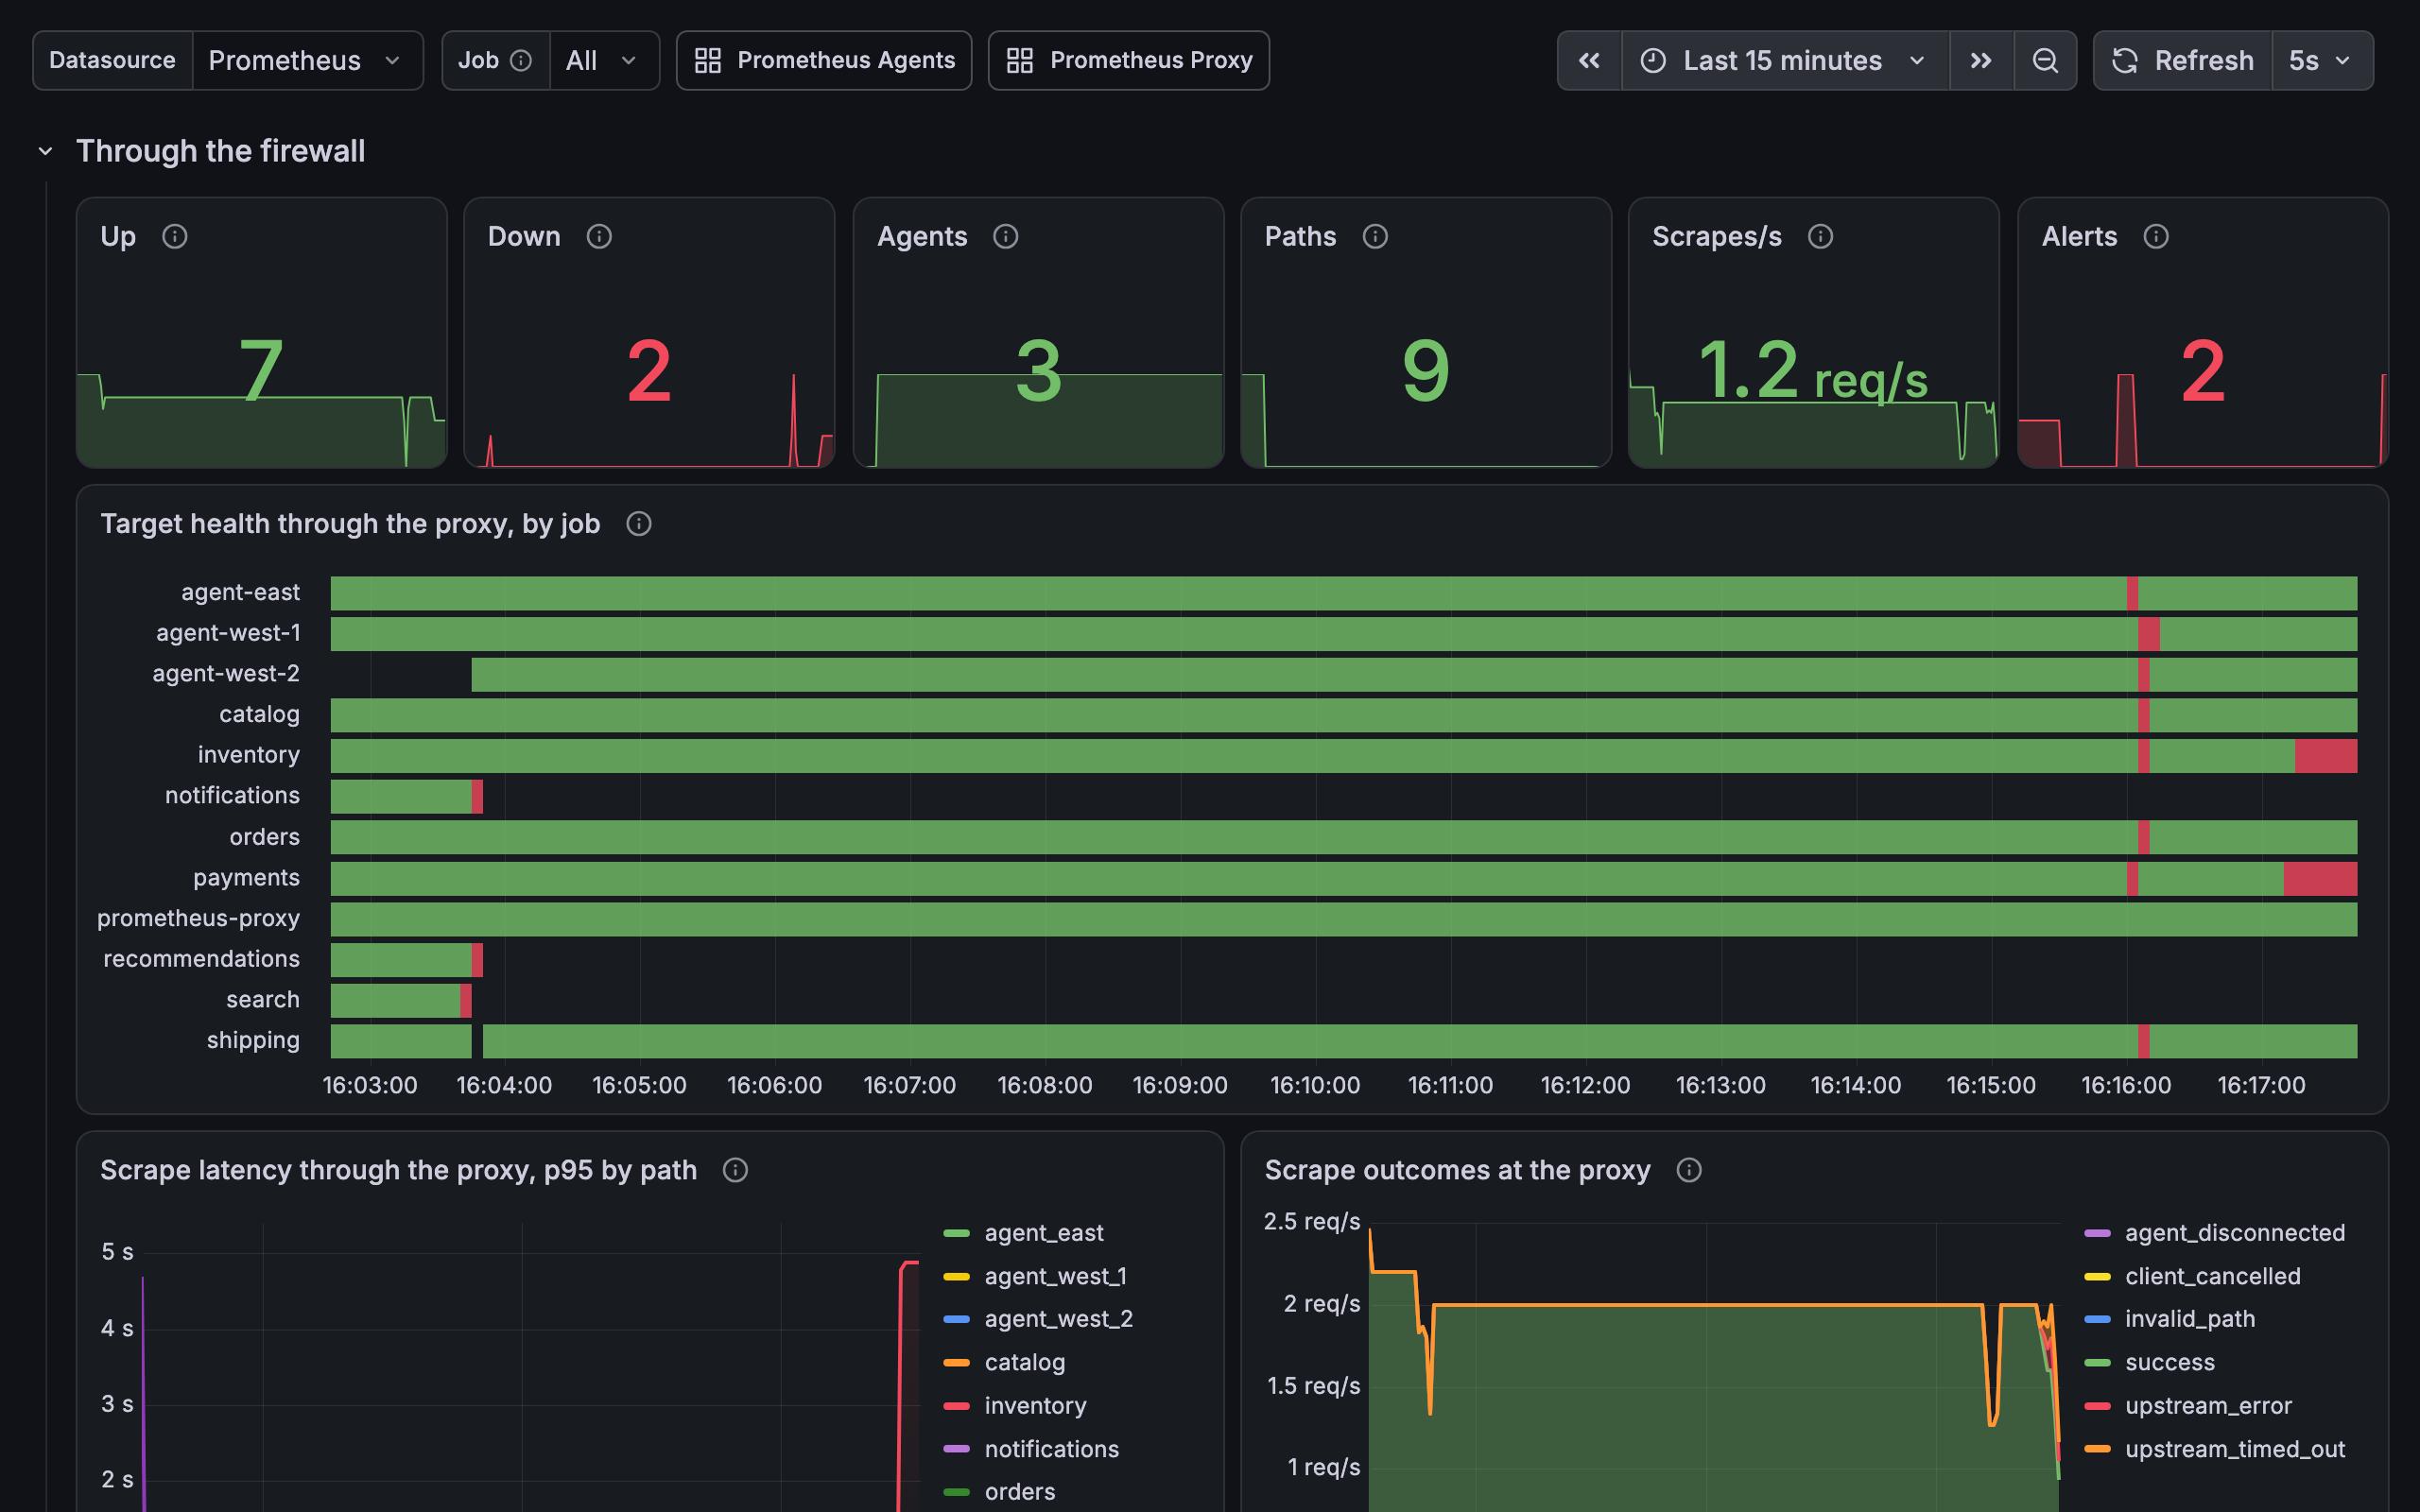
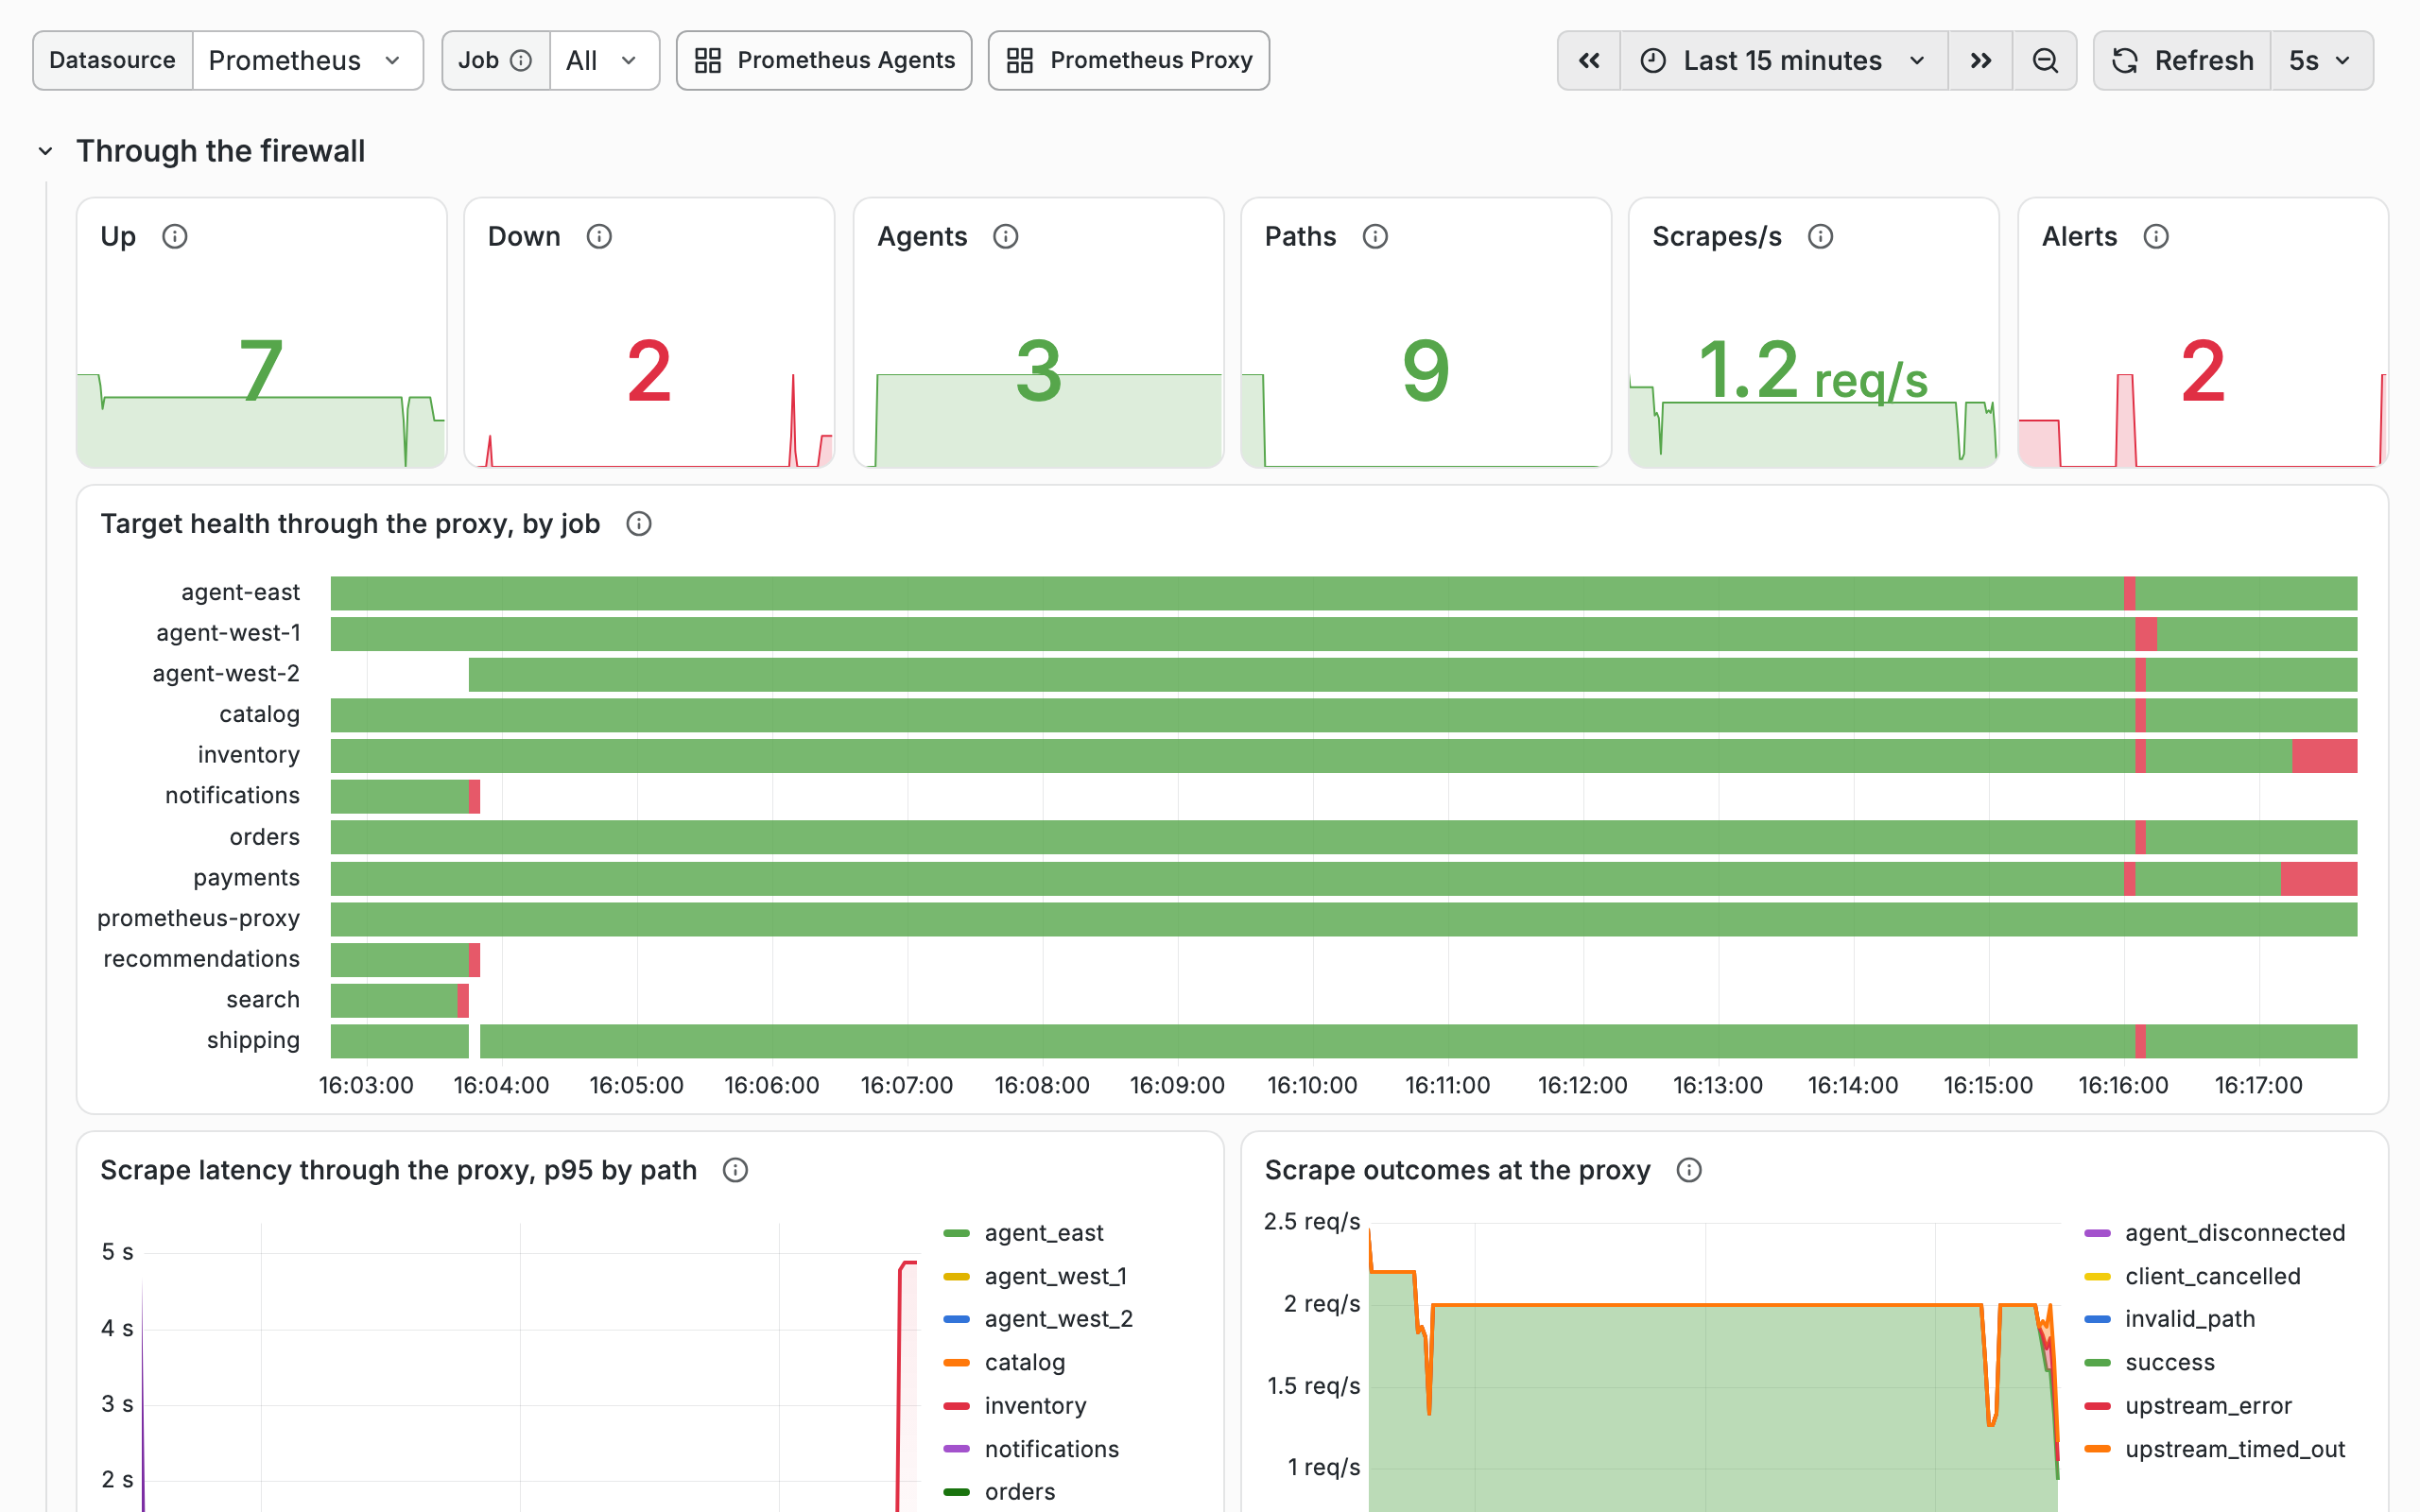
In Grafana, both targets turn red on Target health, Scrape latency spikes for inventory alone, and
Scrape outcomes shows the errors and timeouts at the proxy. After 15 seconds, DemoTargetDown fires for each:
the Alerts stat counts them, and so does Prometheus's /alerts page.
./demo.sh recover returns every service to normal, and the red rows turn green within a scrape or two.
A second agent keeps a path up when one stops
./demo.sh agent-stop      # stops agent-west-2
./demo.sh agent-start     # it reconnects and rejoins in seconds
A stopped agent leaves the dashboard at once, and /shipping_metrics drops from +1 to agent-west-1 alone. In
Grafana, Shipping by replica keeps west-1 flowing, and shipping stays green on Target health.
New services appear without a restart
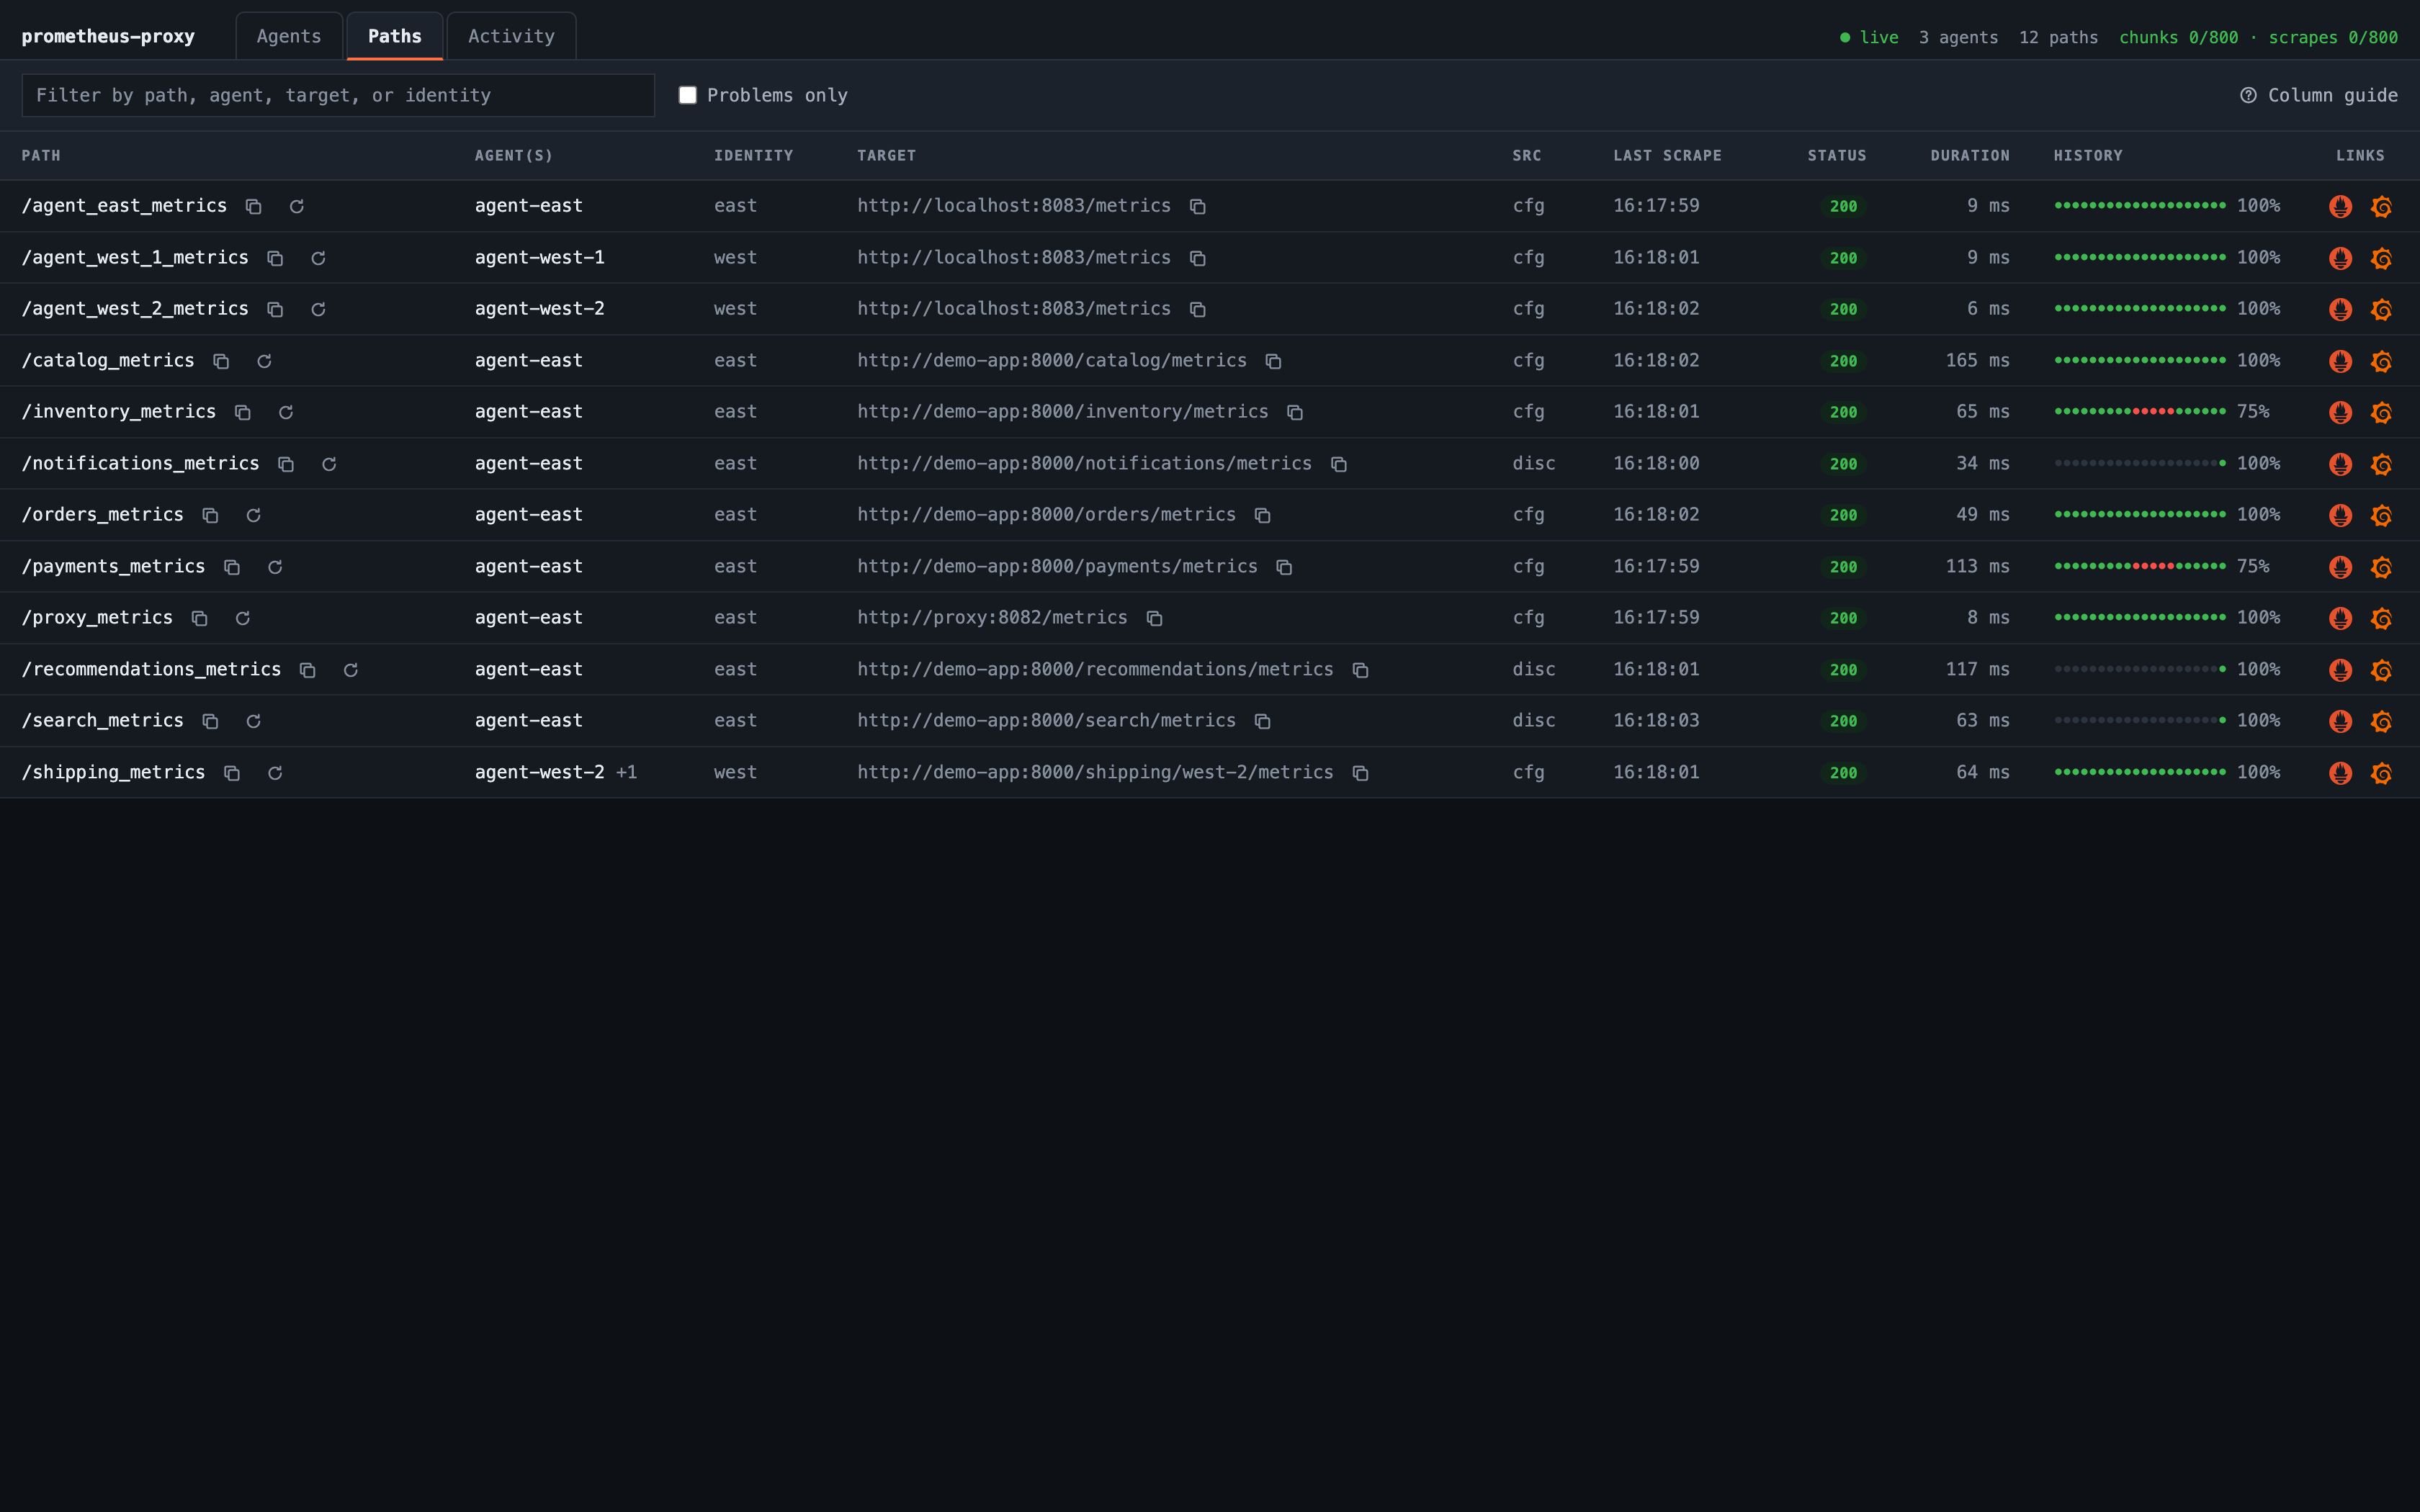
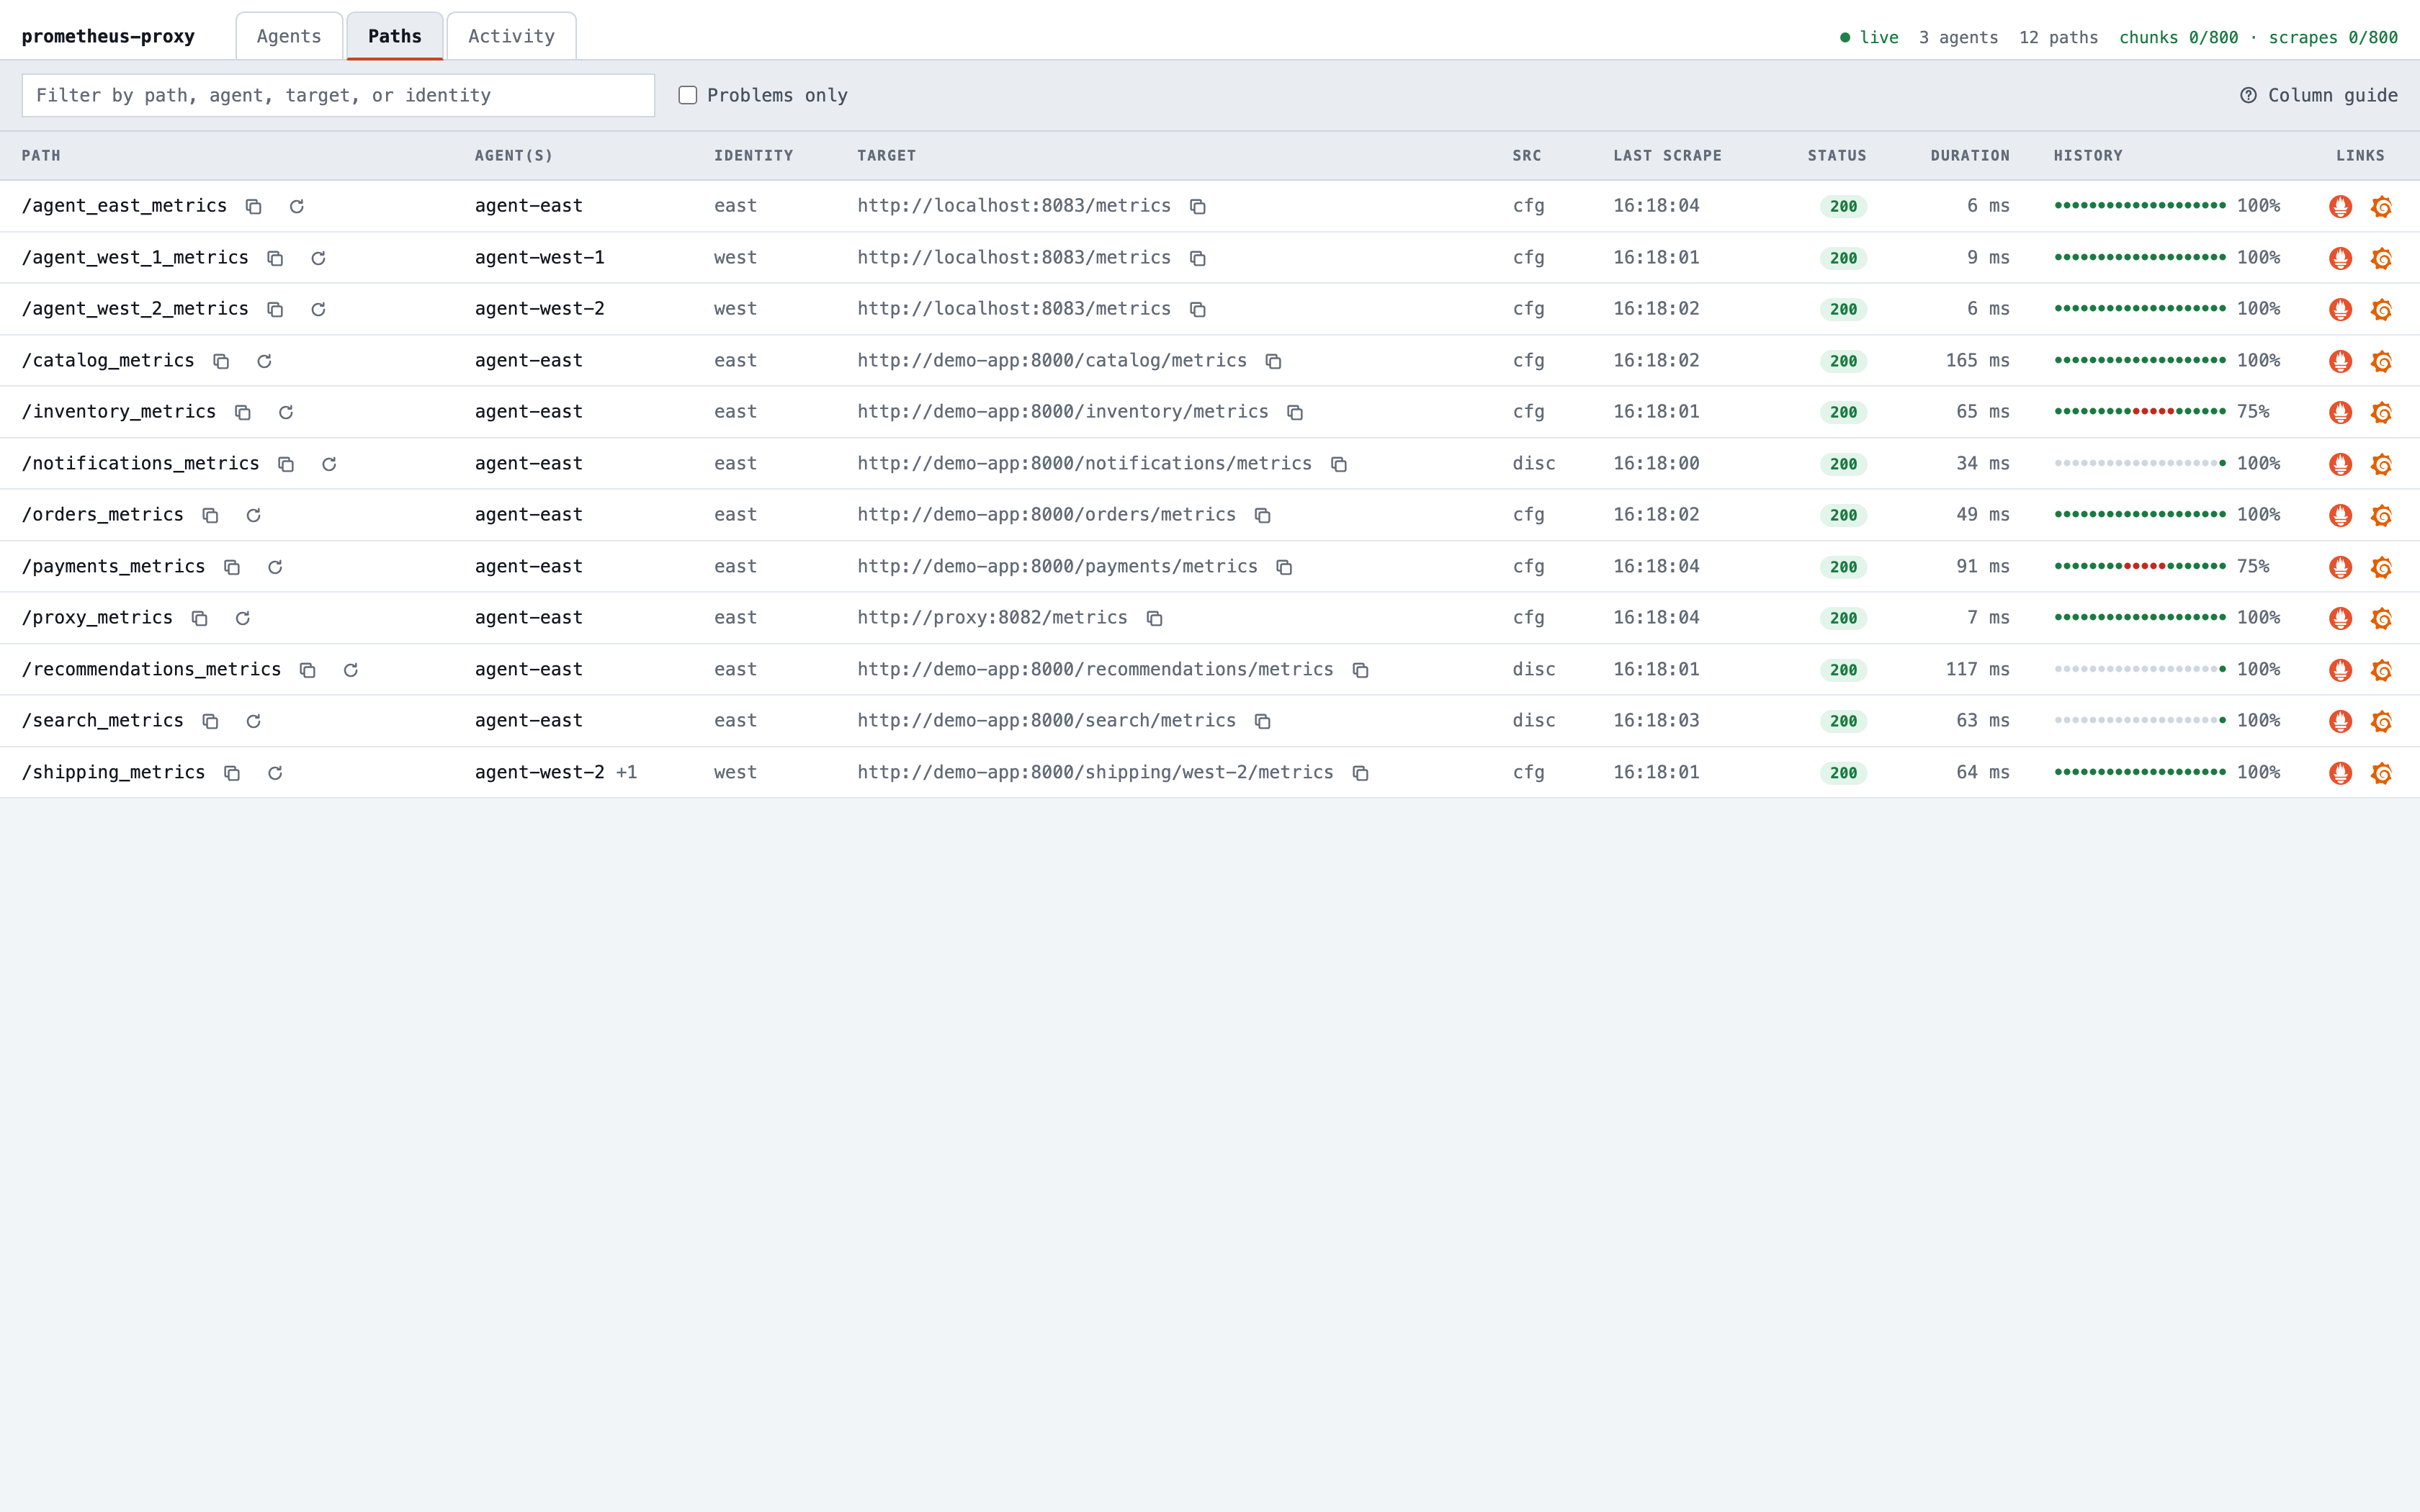
Within about 5 seconds, /search_metrics, /recommendations_metrics, and /notifications_metrics appear with the
source disc (discovered), beside the cfg (configured) paths.
Prometheus finds them through the proxy's service discovery, with no restart and no change to
its config, and Grafana's Discovered services panel fills. ./demo.sh undiscover removes them just as quietly.
The proxy evicts an agent that goes silent
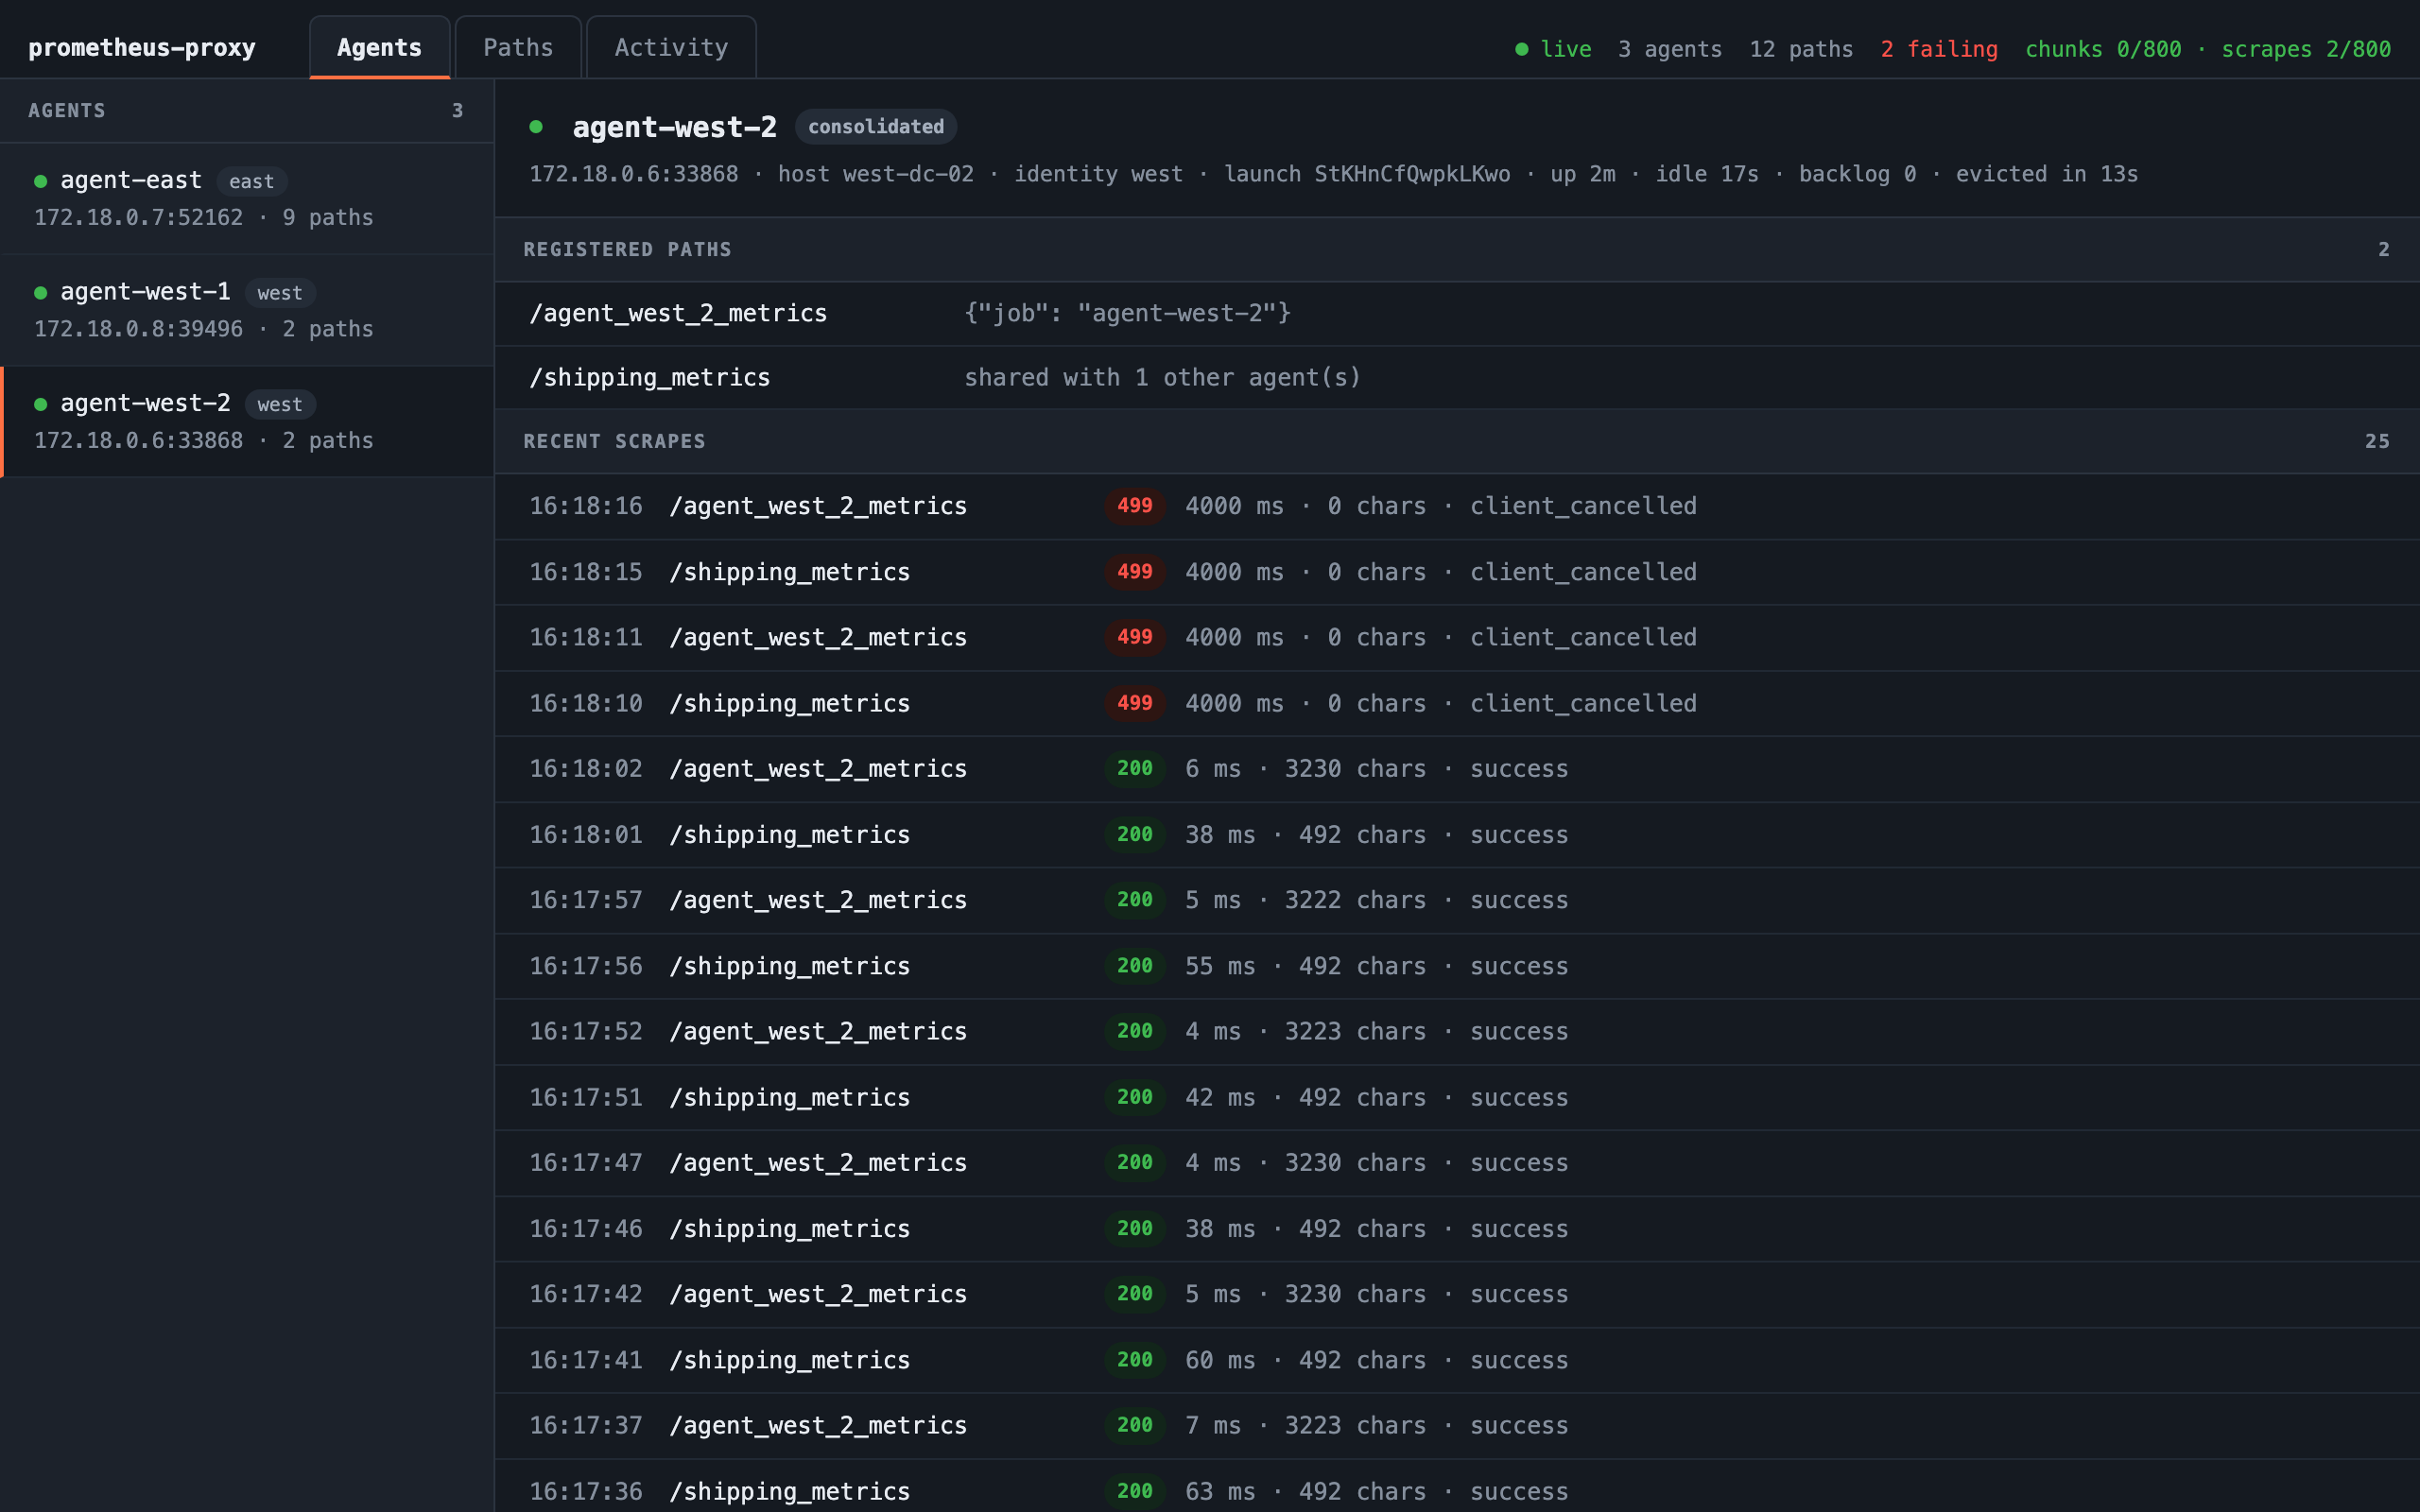
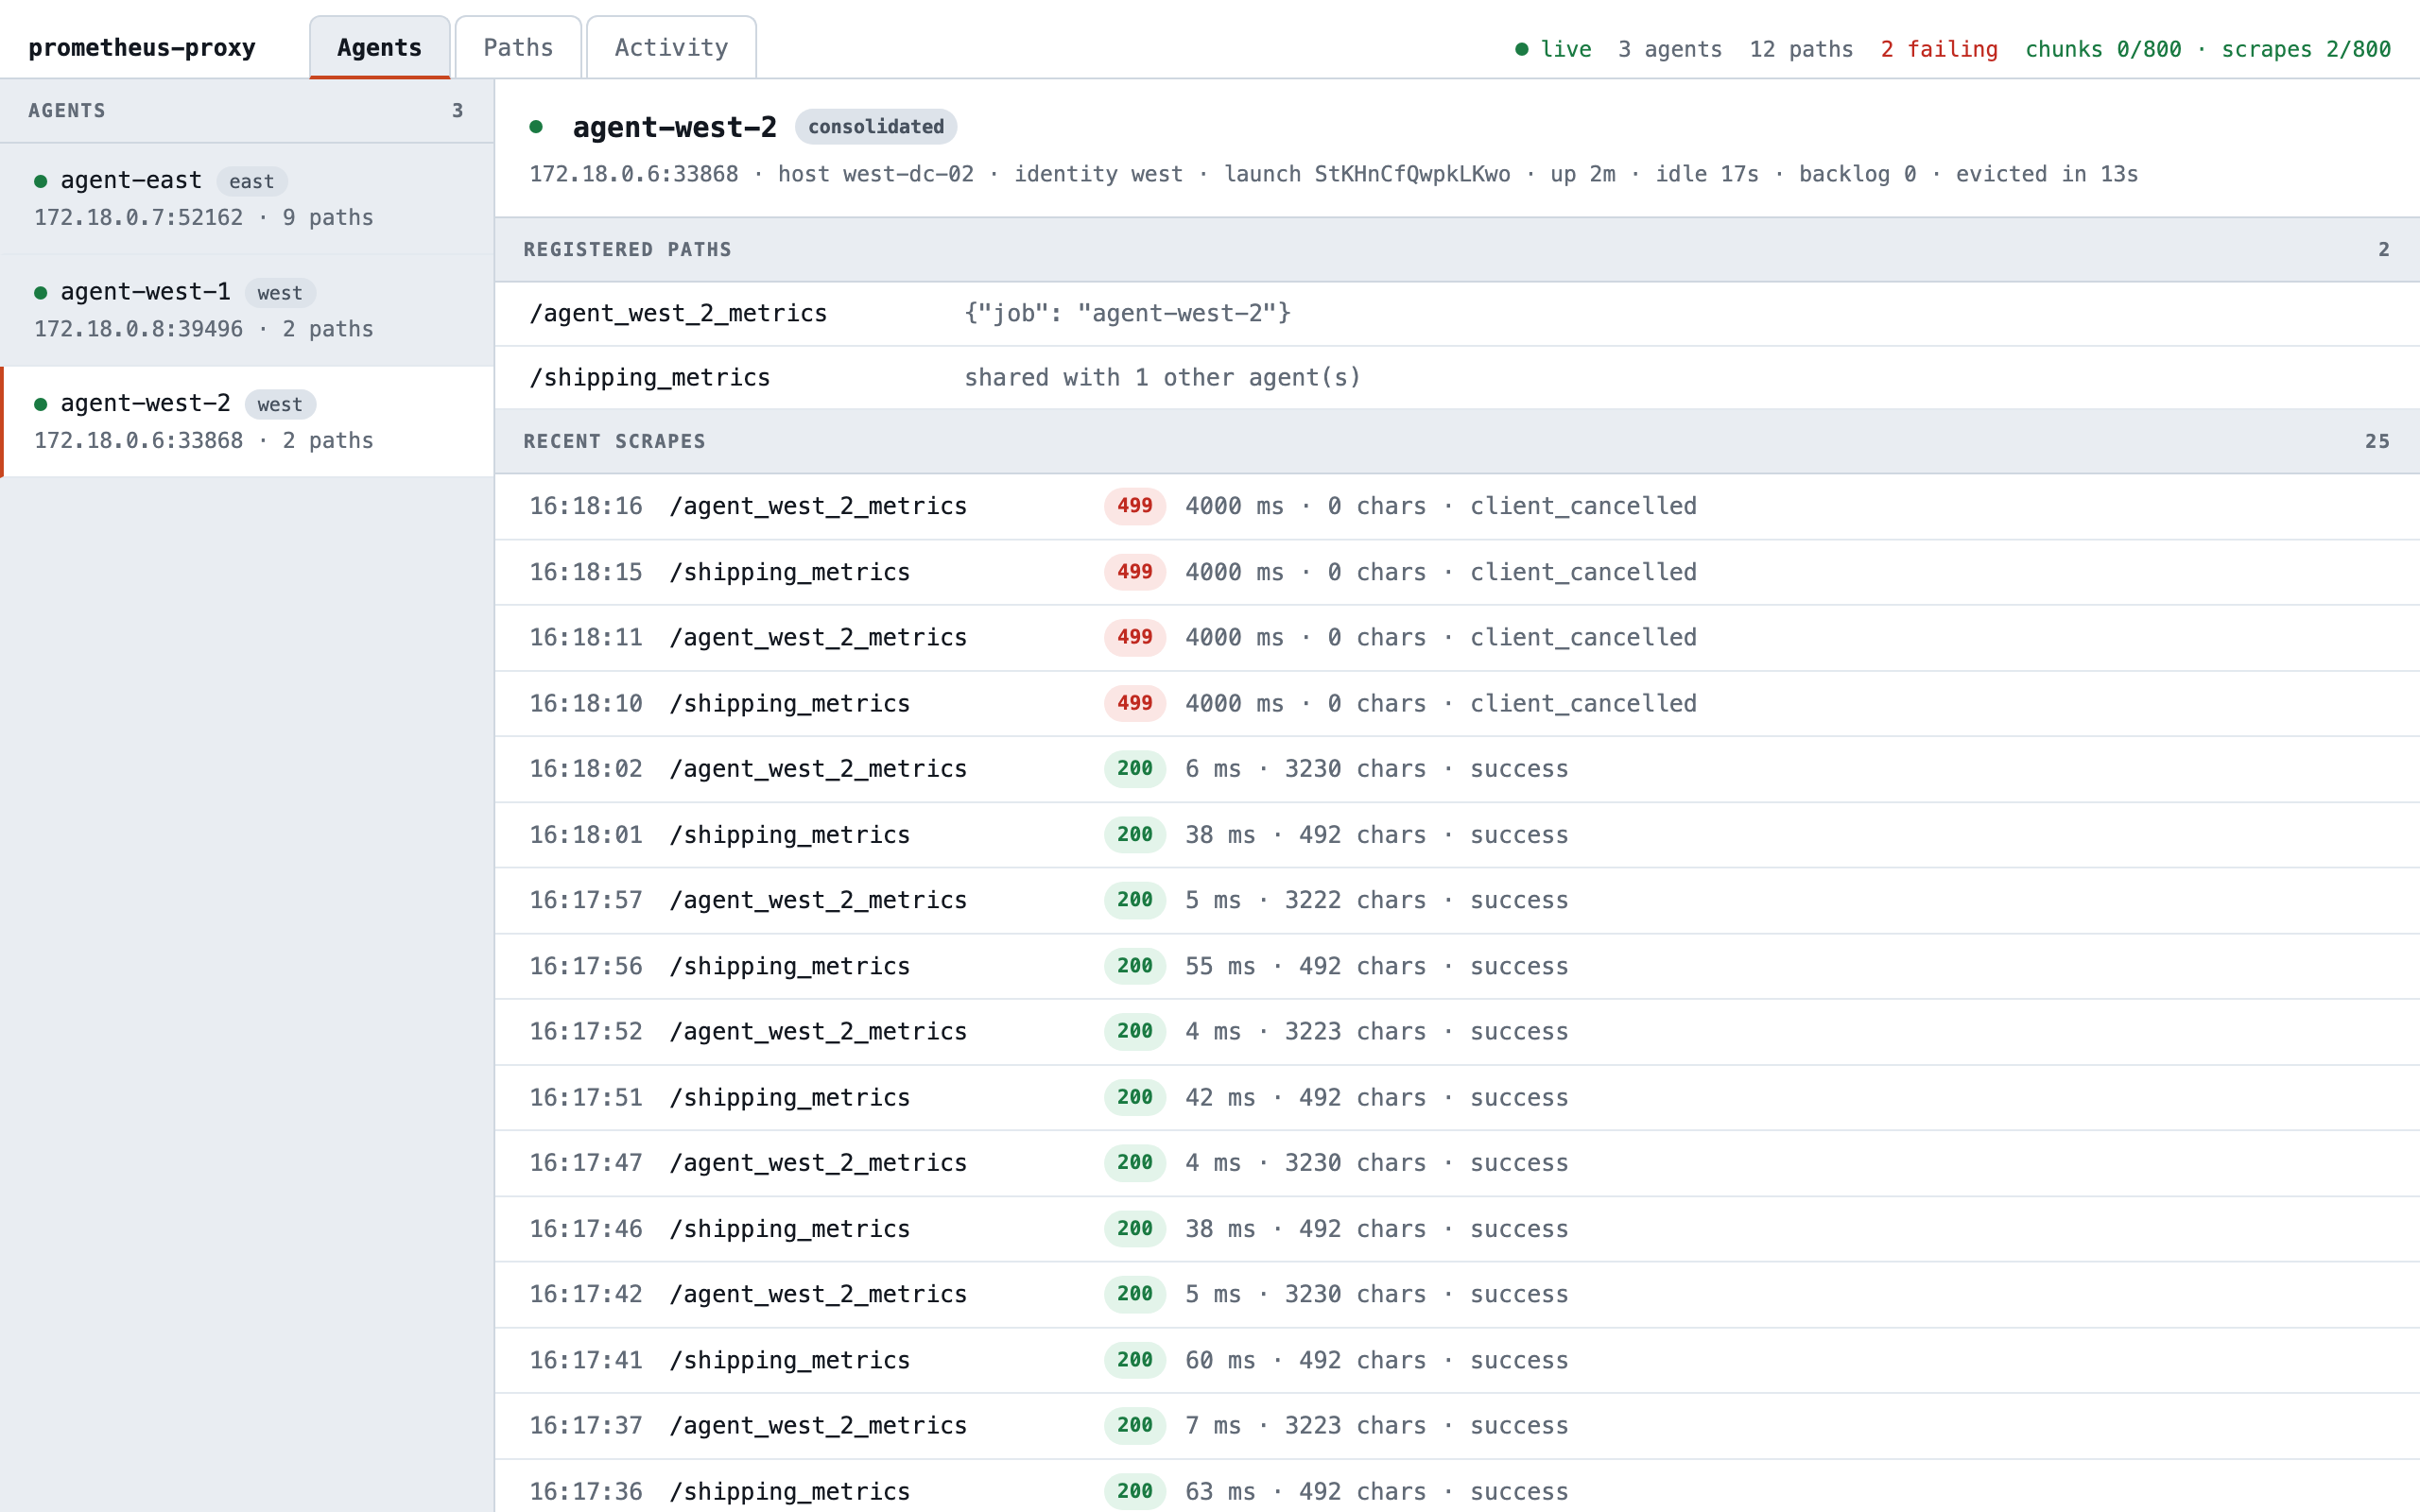
The frozen agent's idle time climbs and its eviction countdown runs; the demo evicts an agent after 30 seconds of
silence. A consolidated path waits for every agent that serves it, so /shipping_metrics stalls too, and Prometheus's
scrapes of both paths give up at its 4-second timeout, recorded as 499 (client_cancelled).
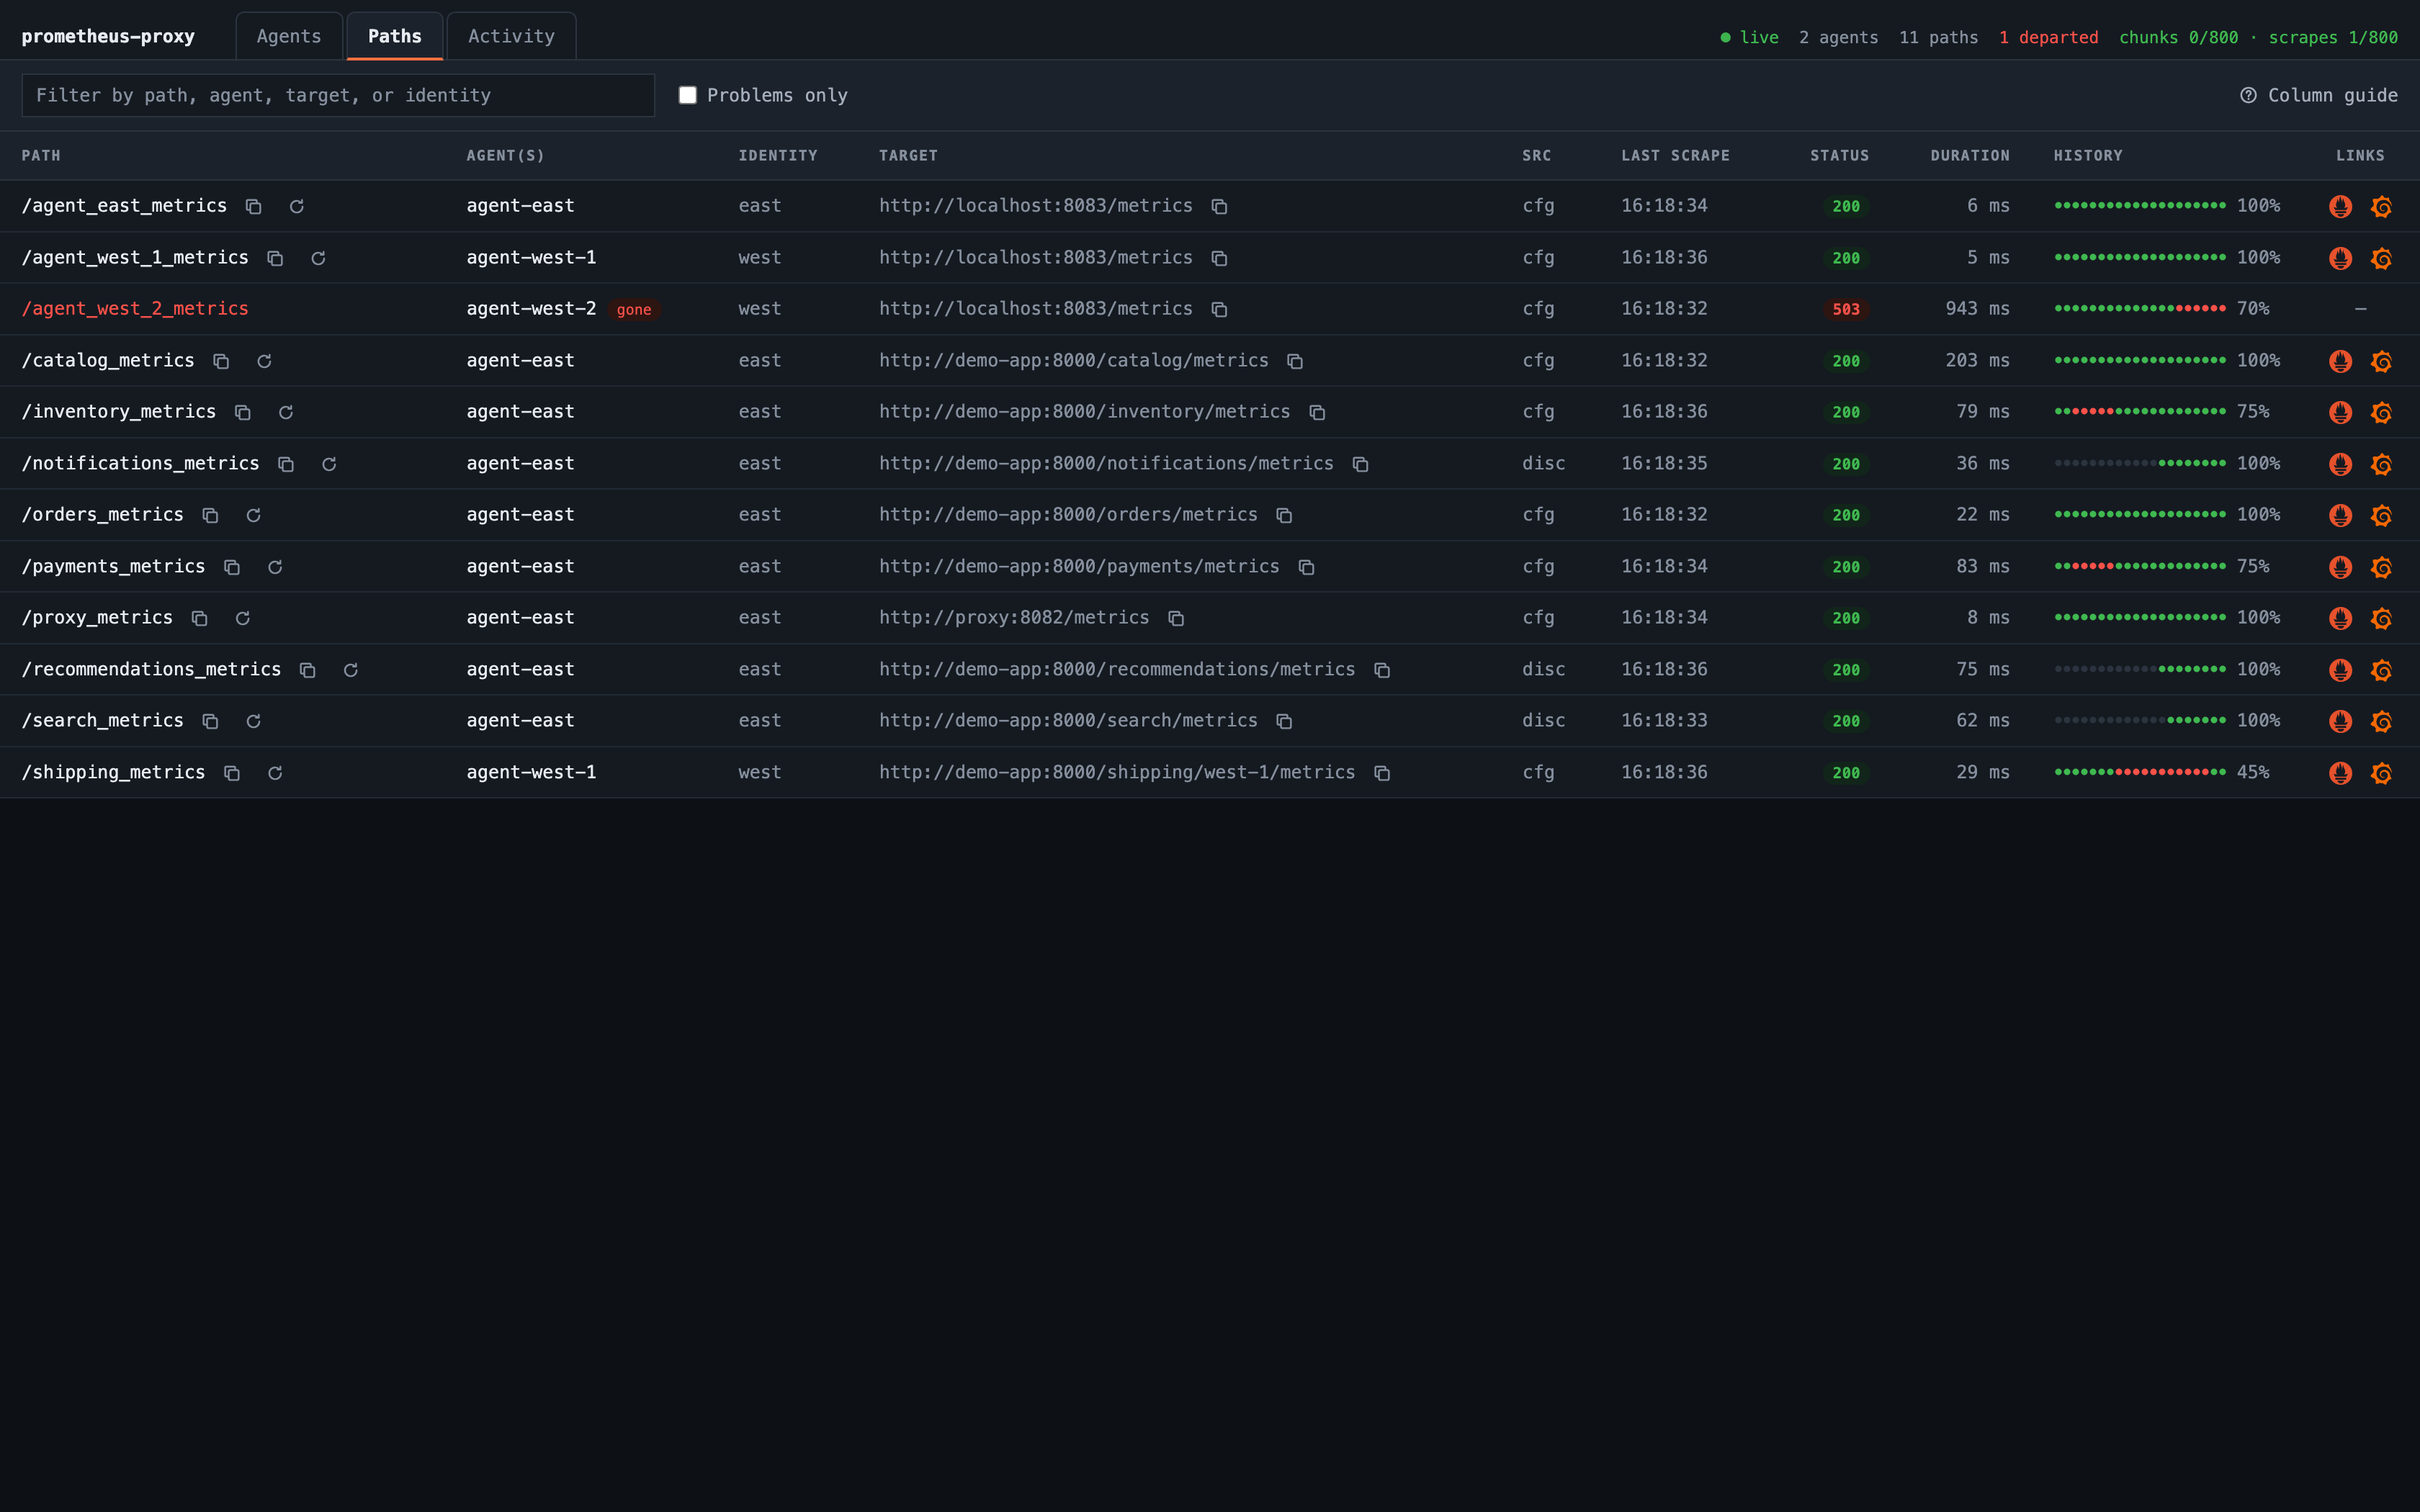
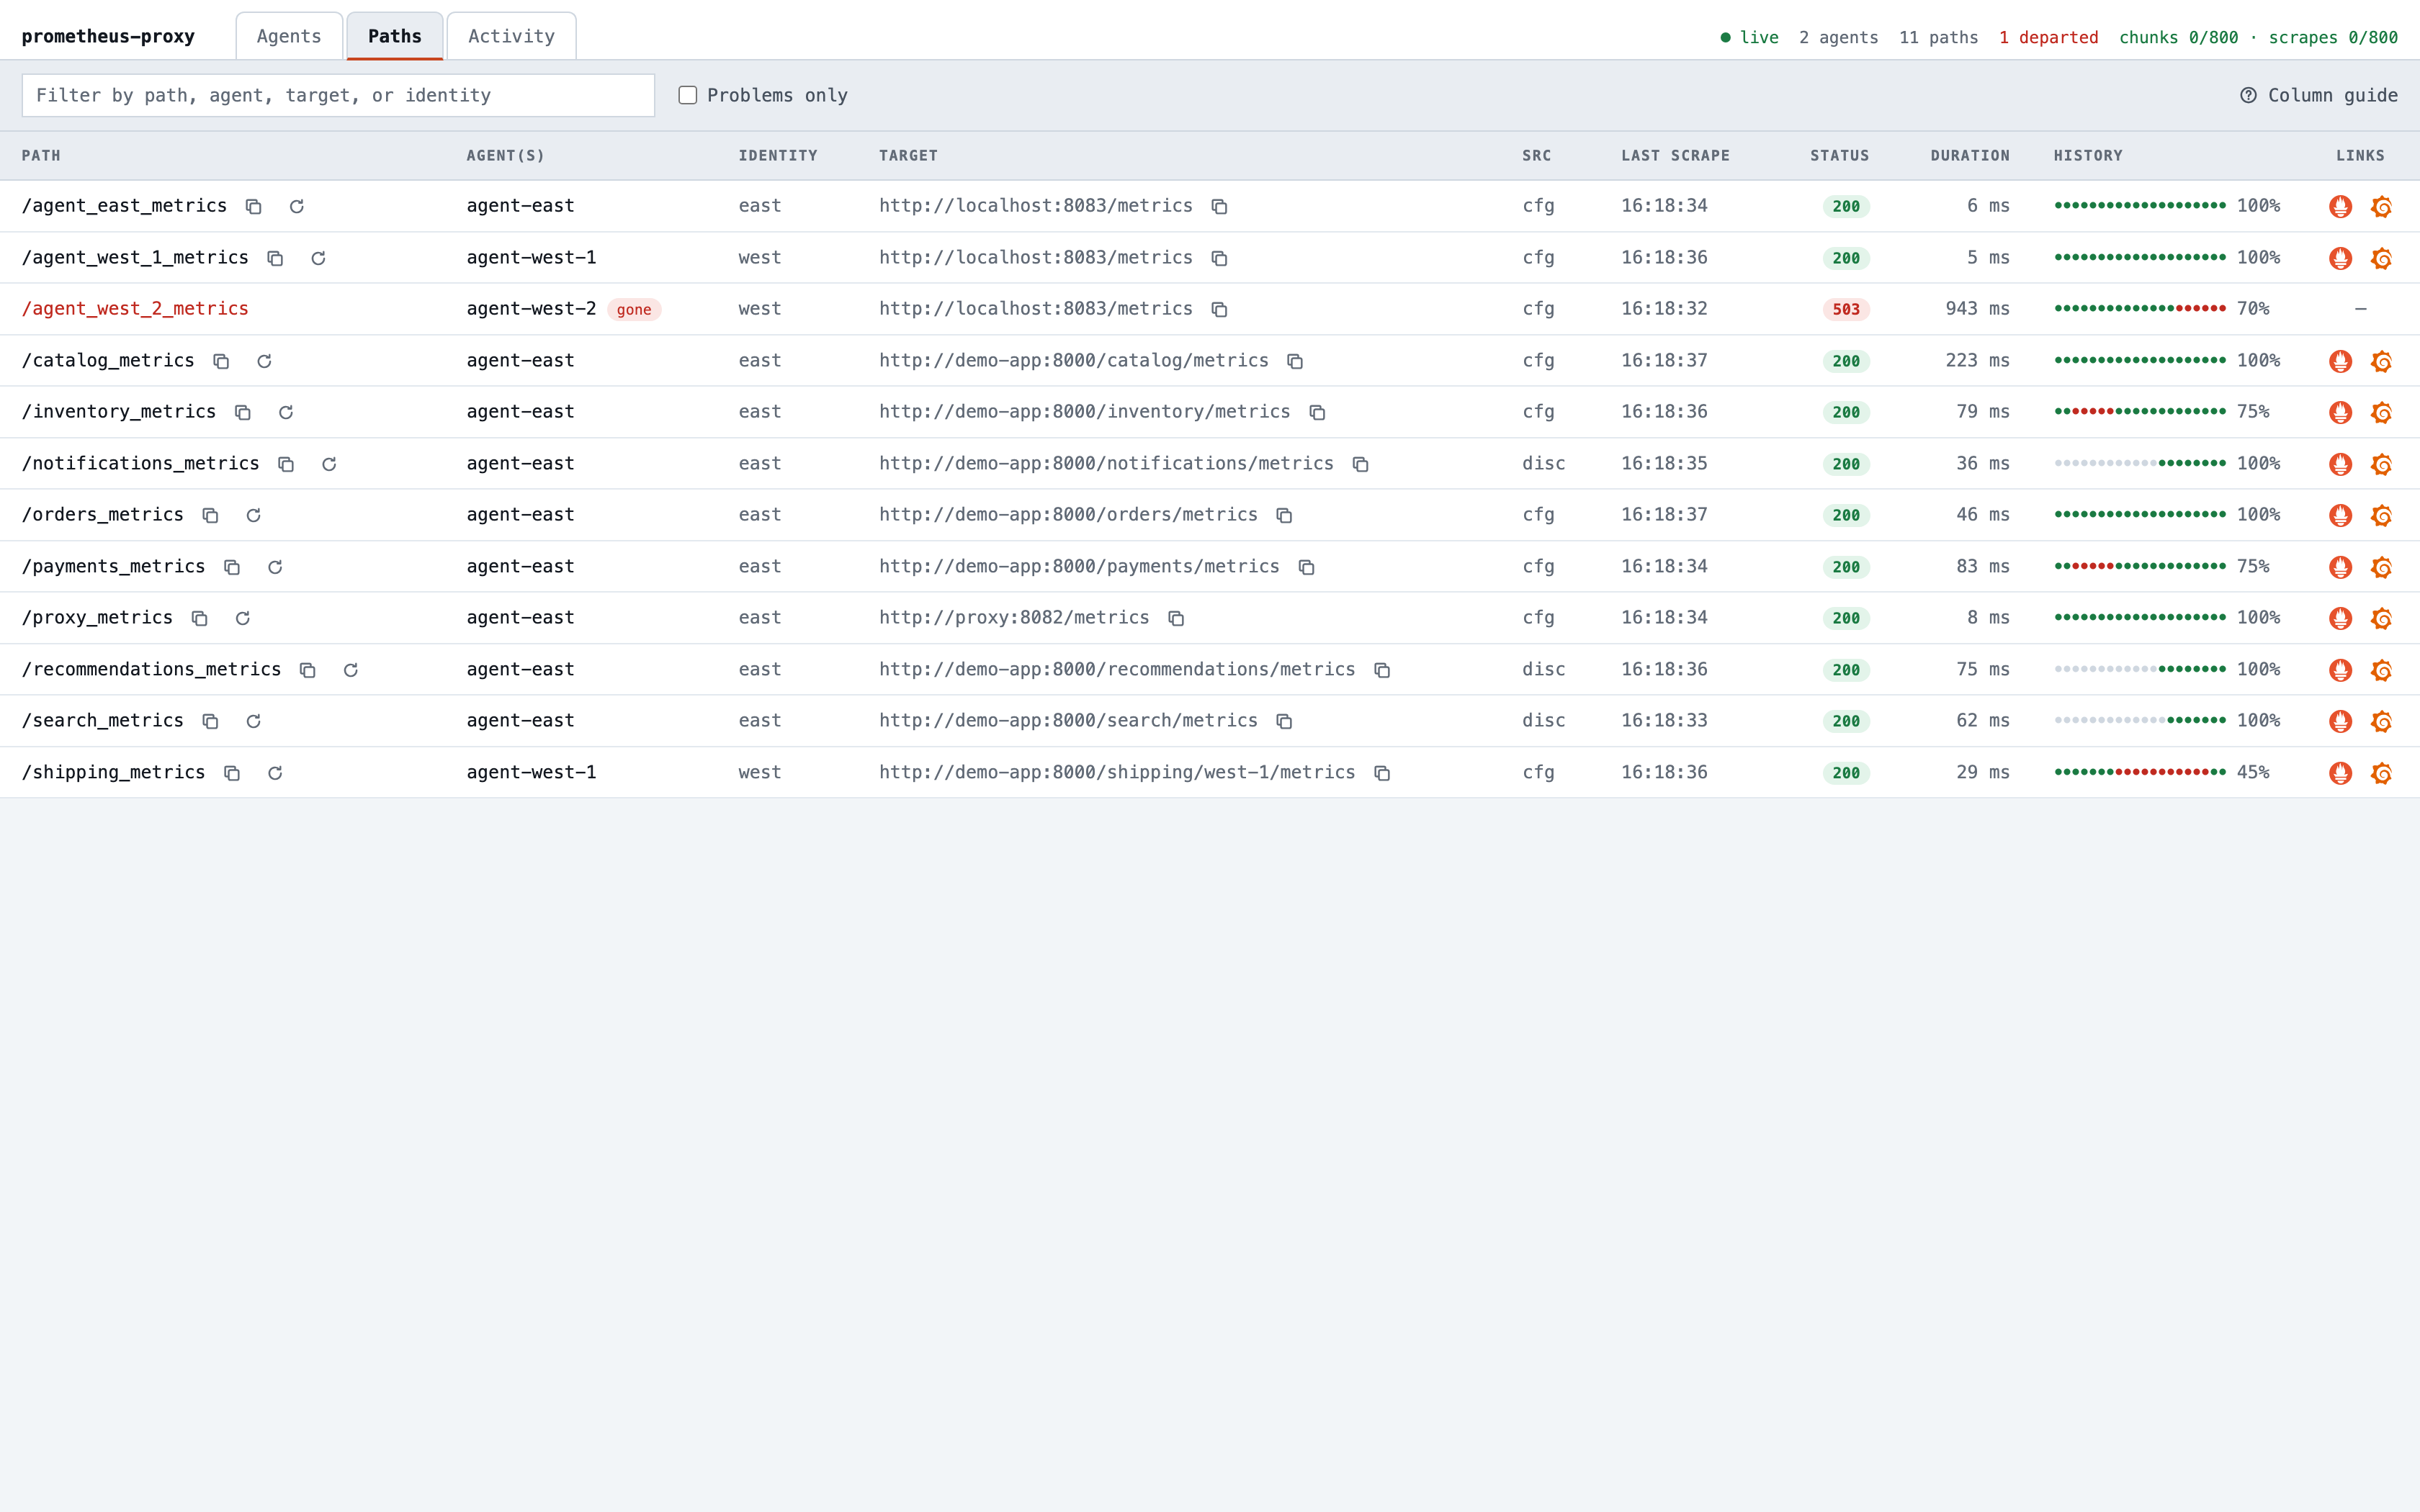
Once the proxy evicts it, agent-west-2's own /agent_west_2_metrics stays in the Paths view marked gone, the status
bar counts it as departed, and agent-west-1 carries /shipping_metrics alone, which now shows agent-west-1's own
target. The Activity view lists the eviction as a problem, with how long the proxy waited and the paths the agent
served. ./demo.sh agent-thaw unfreezes the agent, and it reconnects and registers again.
Per-team tokens restrict which paths an agent can register
The proxy has per-agent identities: each data center's agents connect with their own token, and an identity may register only the paths its patterns allow.
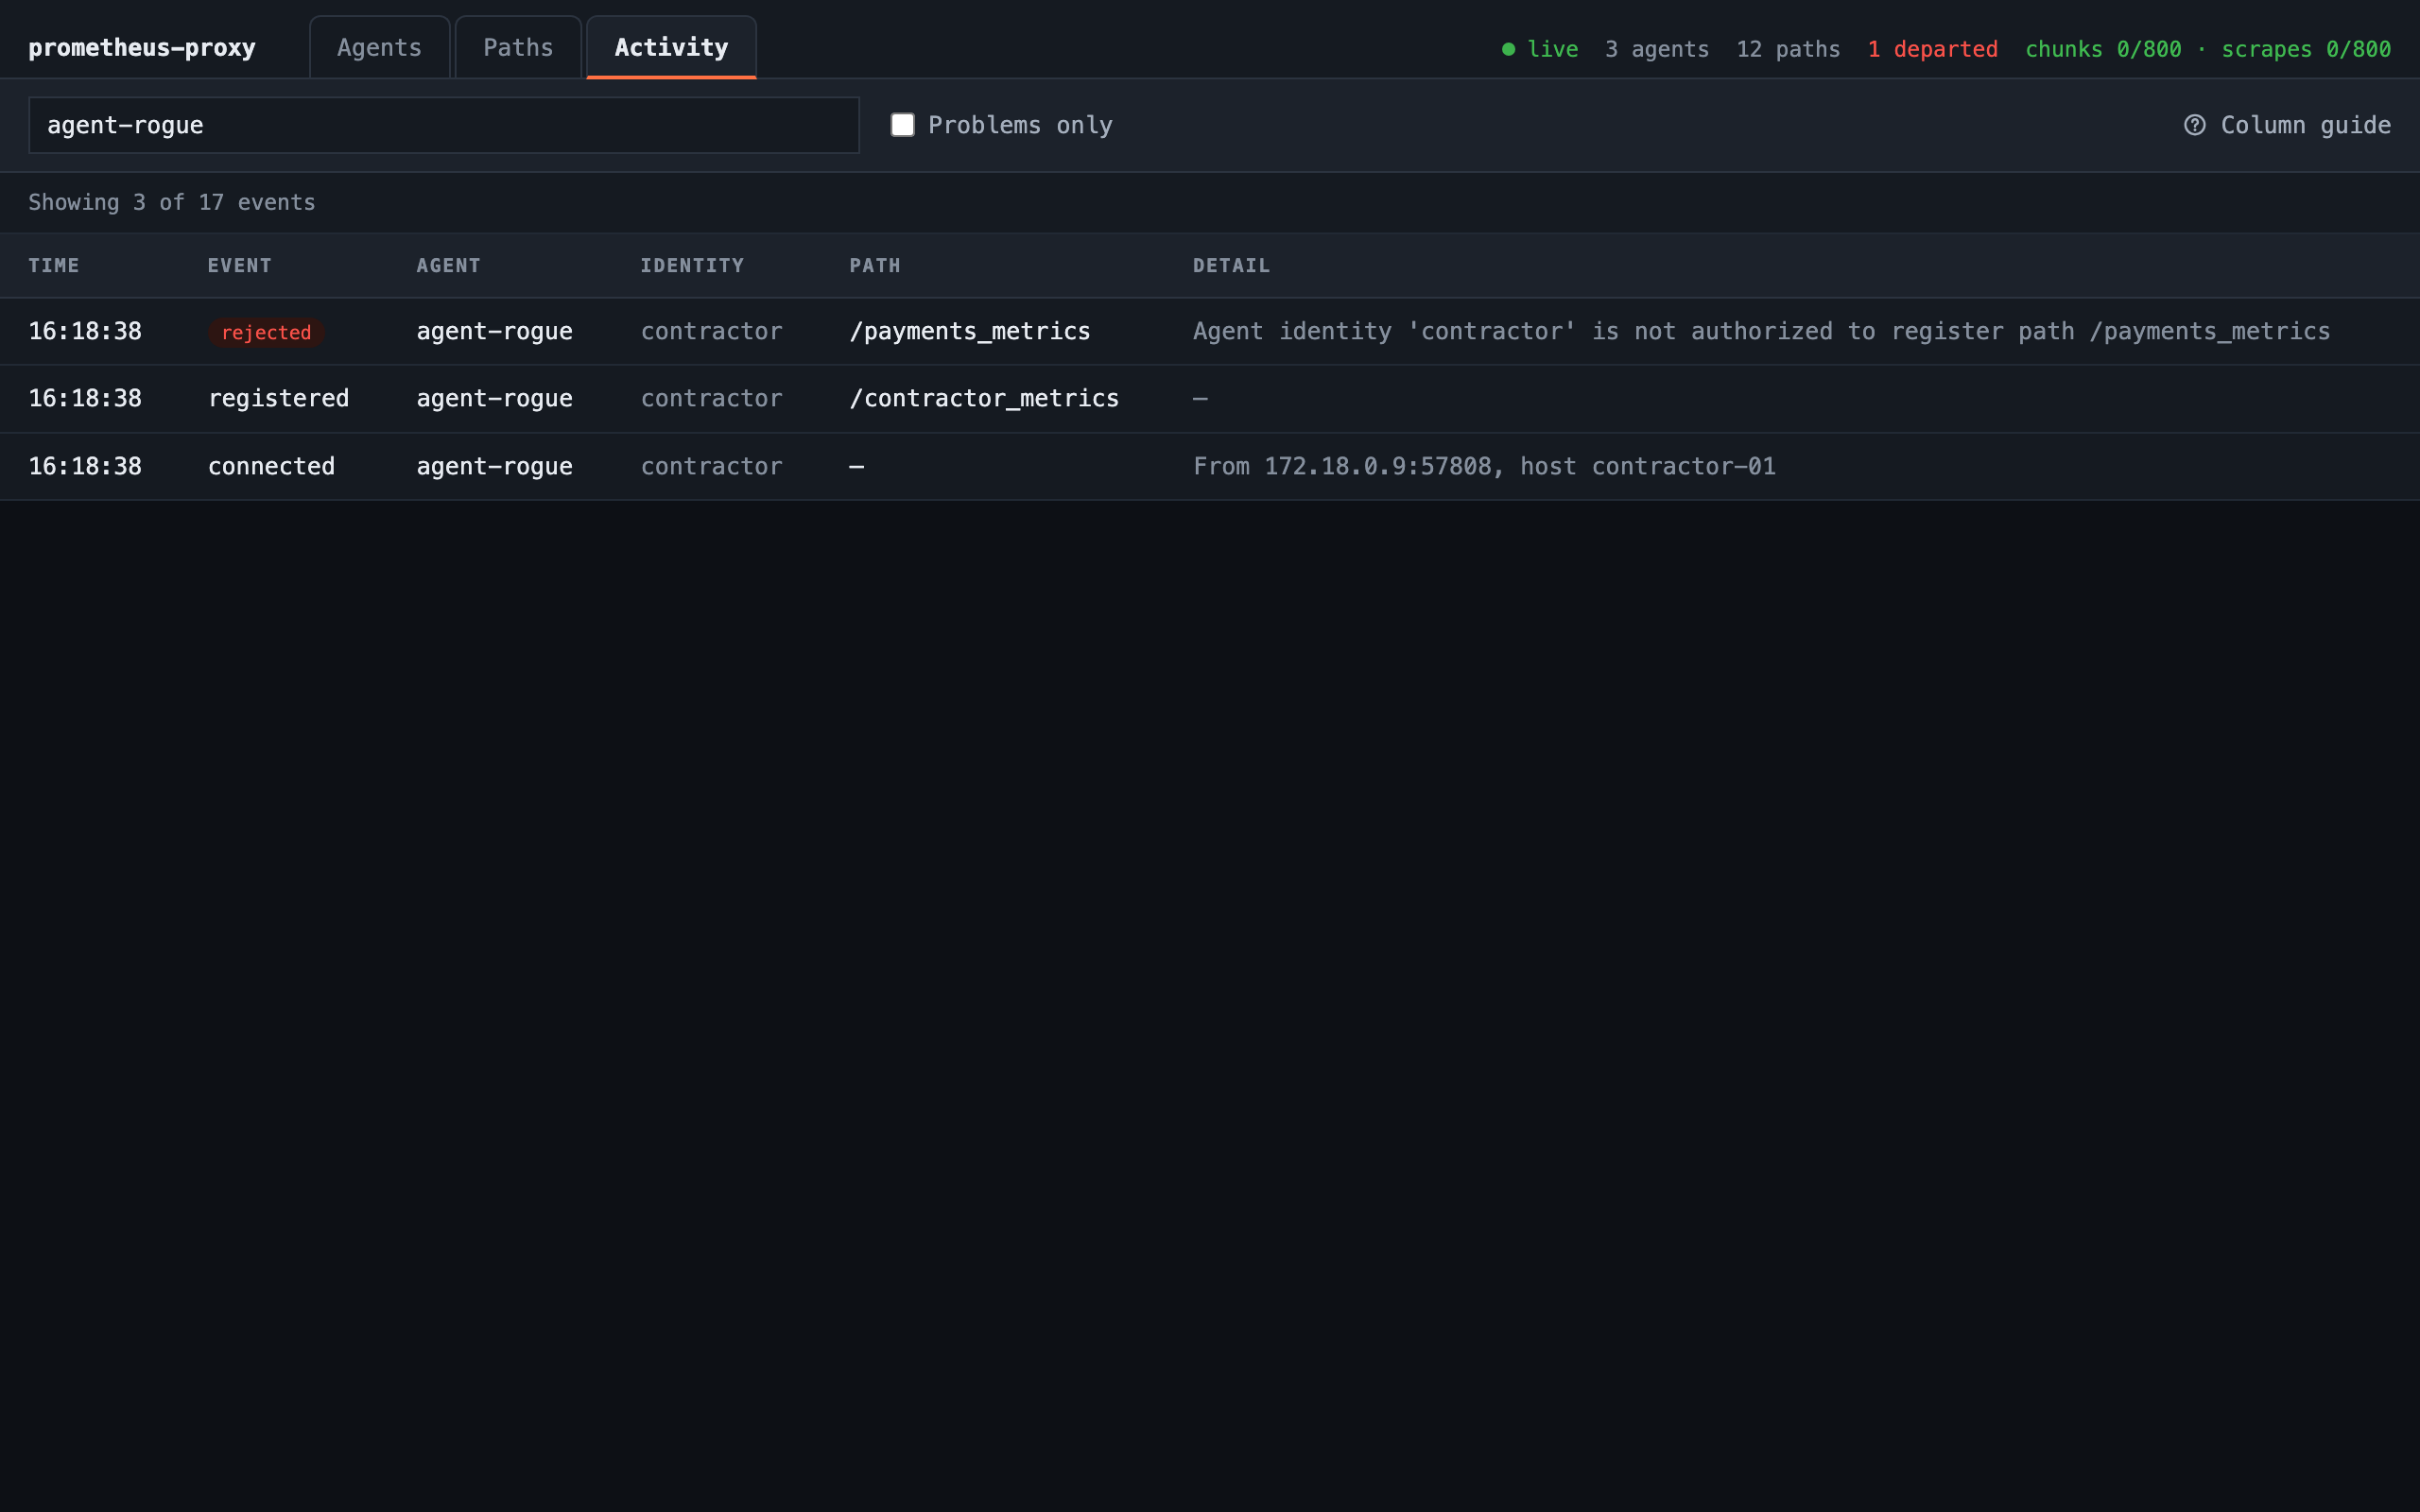
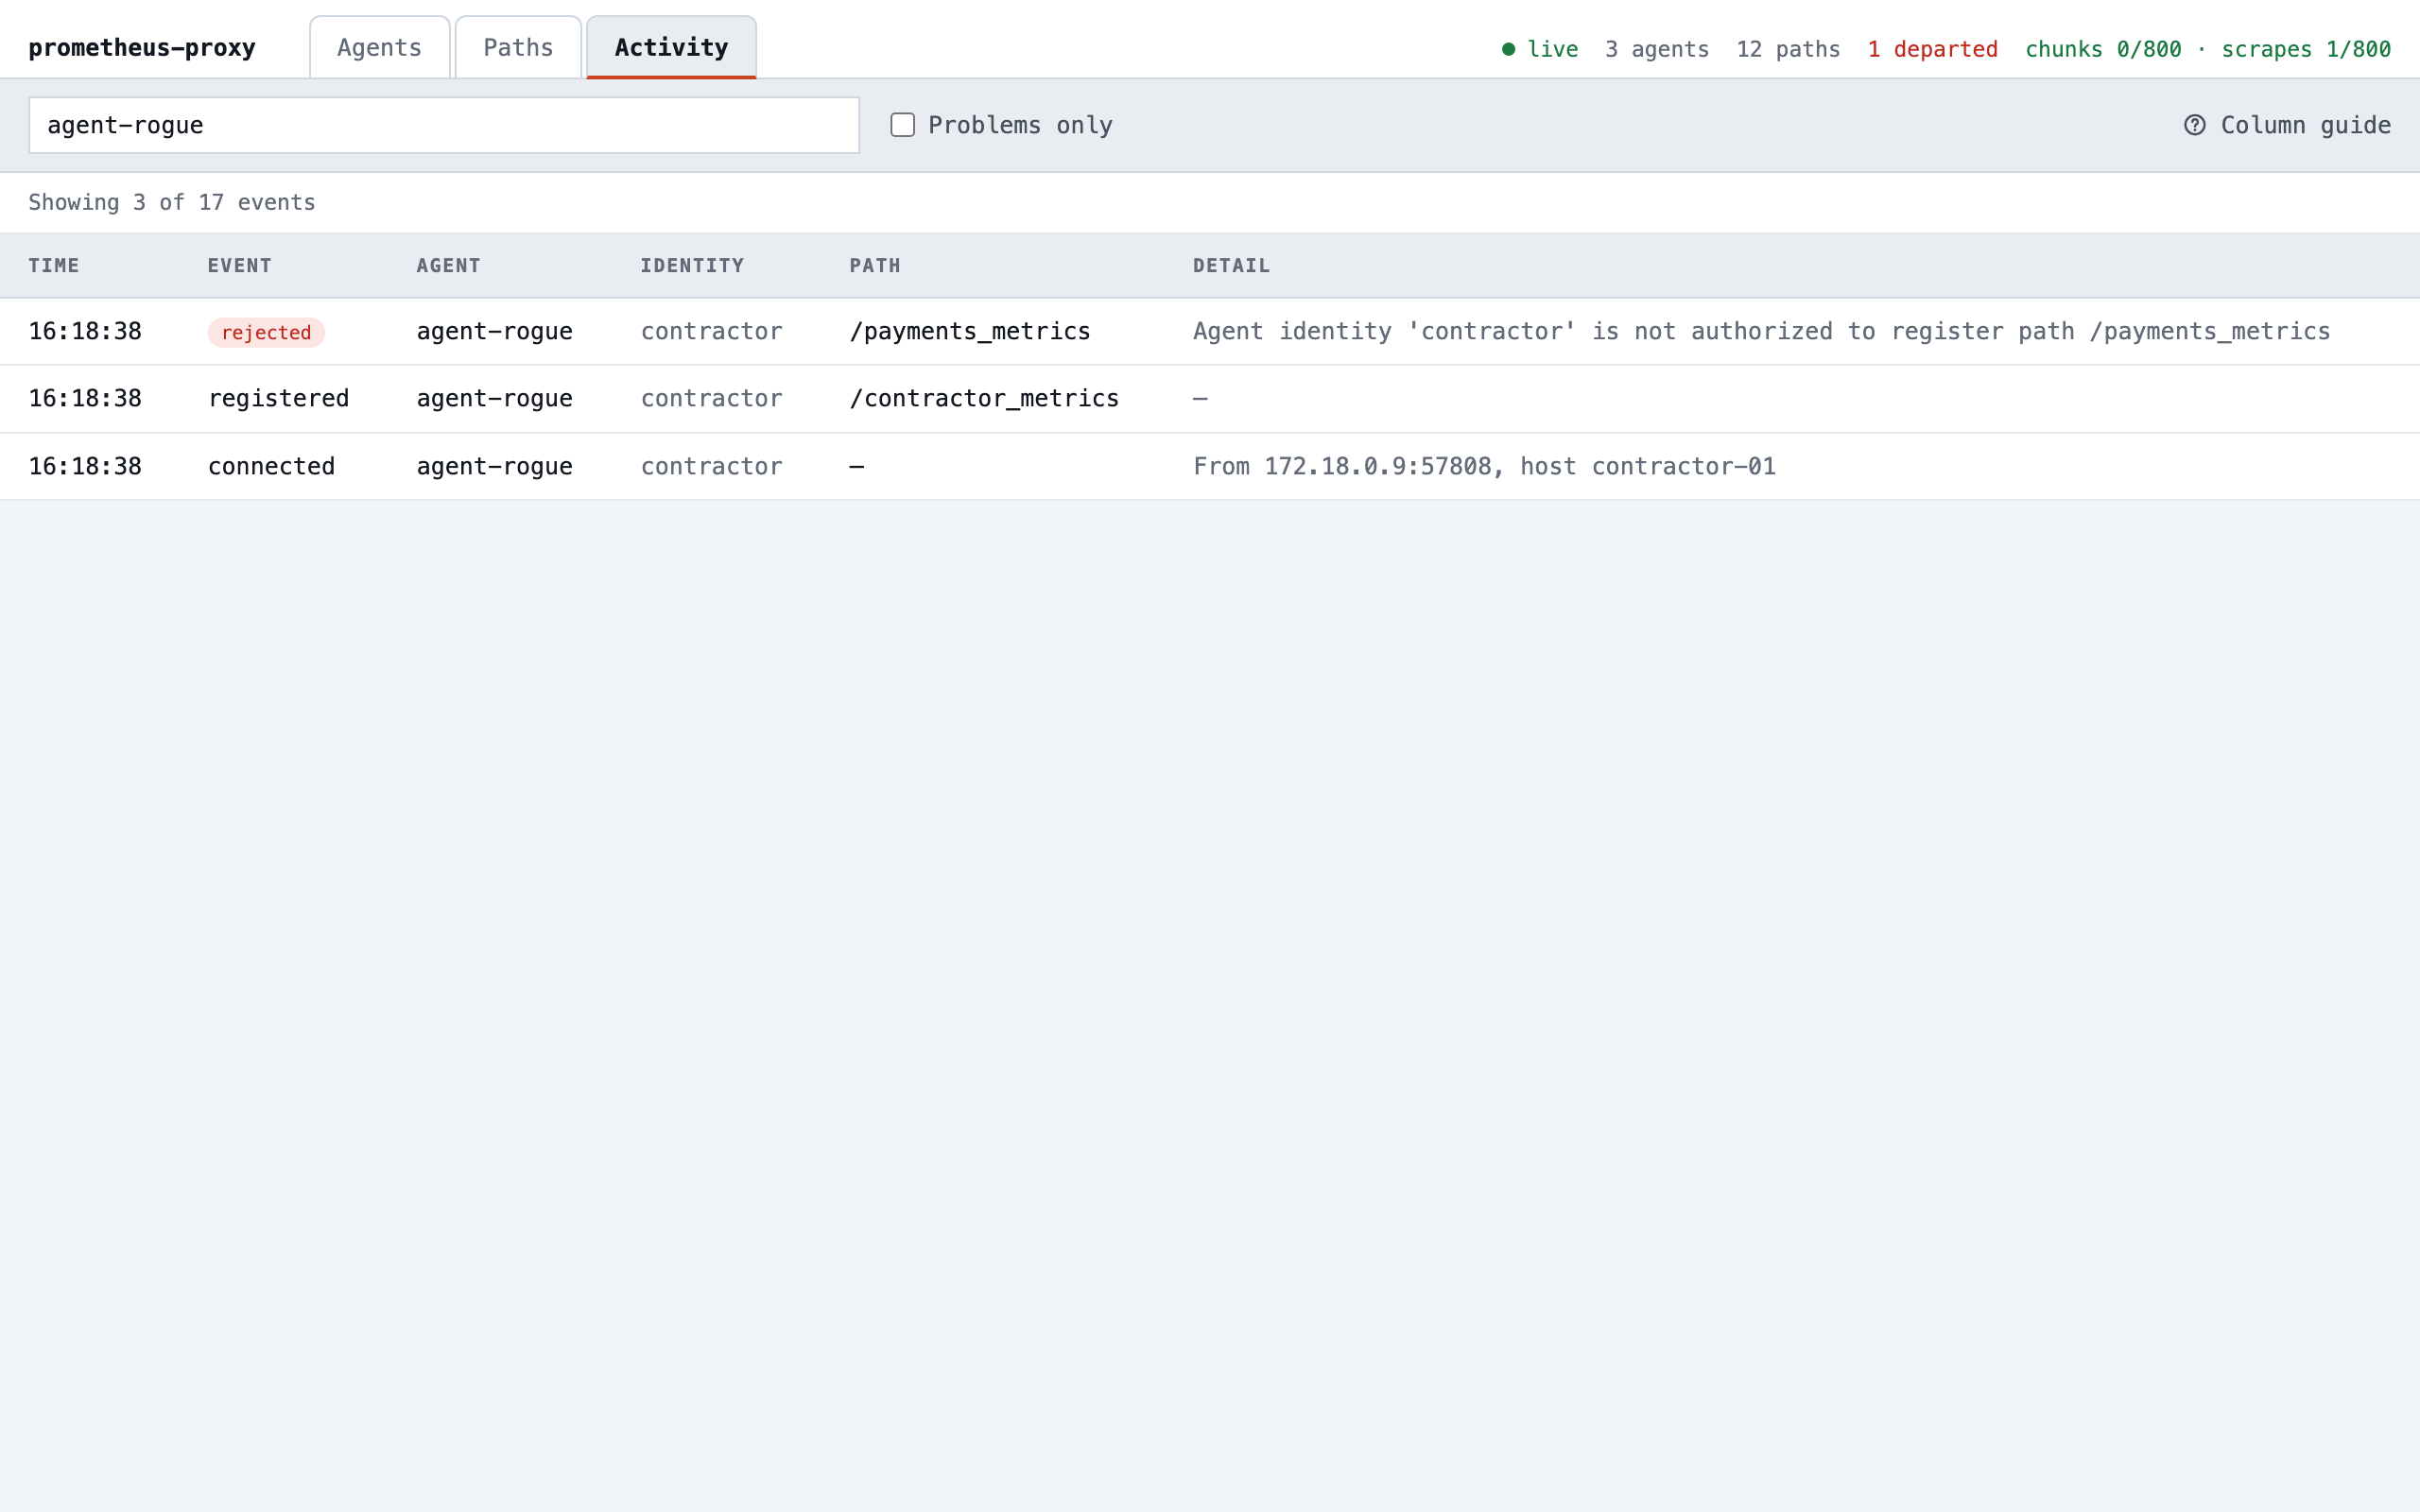
The contractor's agent appears on the dashboard with the one path its identity allows, /contractor_metrics. Its
/payments_metrics is refused, which no list of agents or paths can show, since nothing was added. The Activity view
shows it, searched here for the contractor's agent:
The command also prints the proxy's log line:
WARN [ProxyServiceImpl.kt:335] - Agent identity 'contractor' denied registration of path /payments_metrics
Payments keeps coming from agent-east, untouched. With a shared token, the newer agent would have taken the path
over. ./demo.sh rogue-agent-stop removes it.
A duplicate agent takes over the paths, and the proxy logs the fix
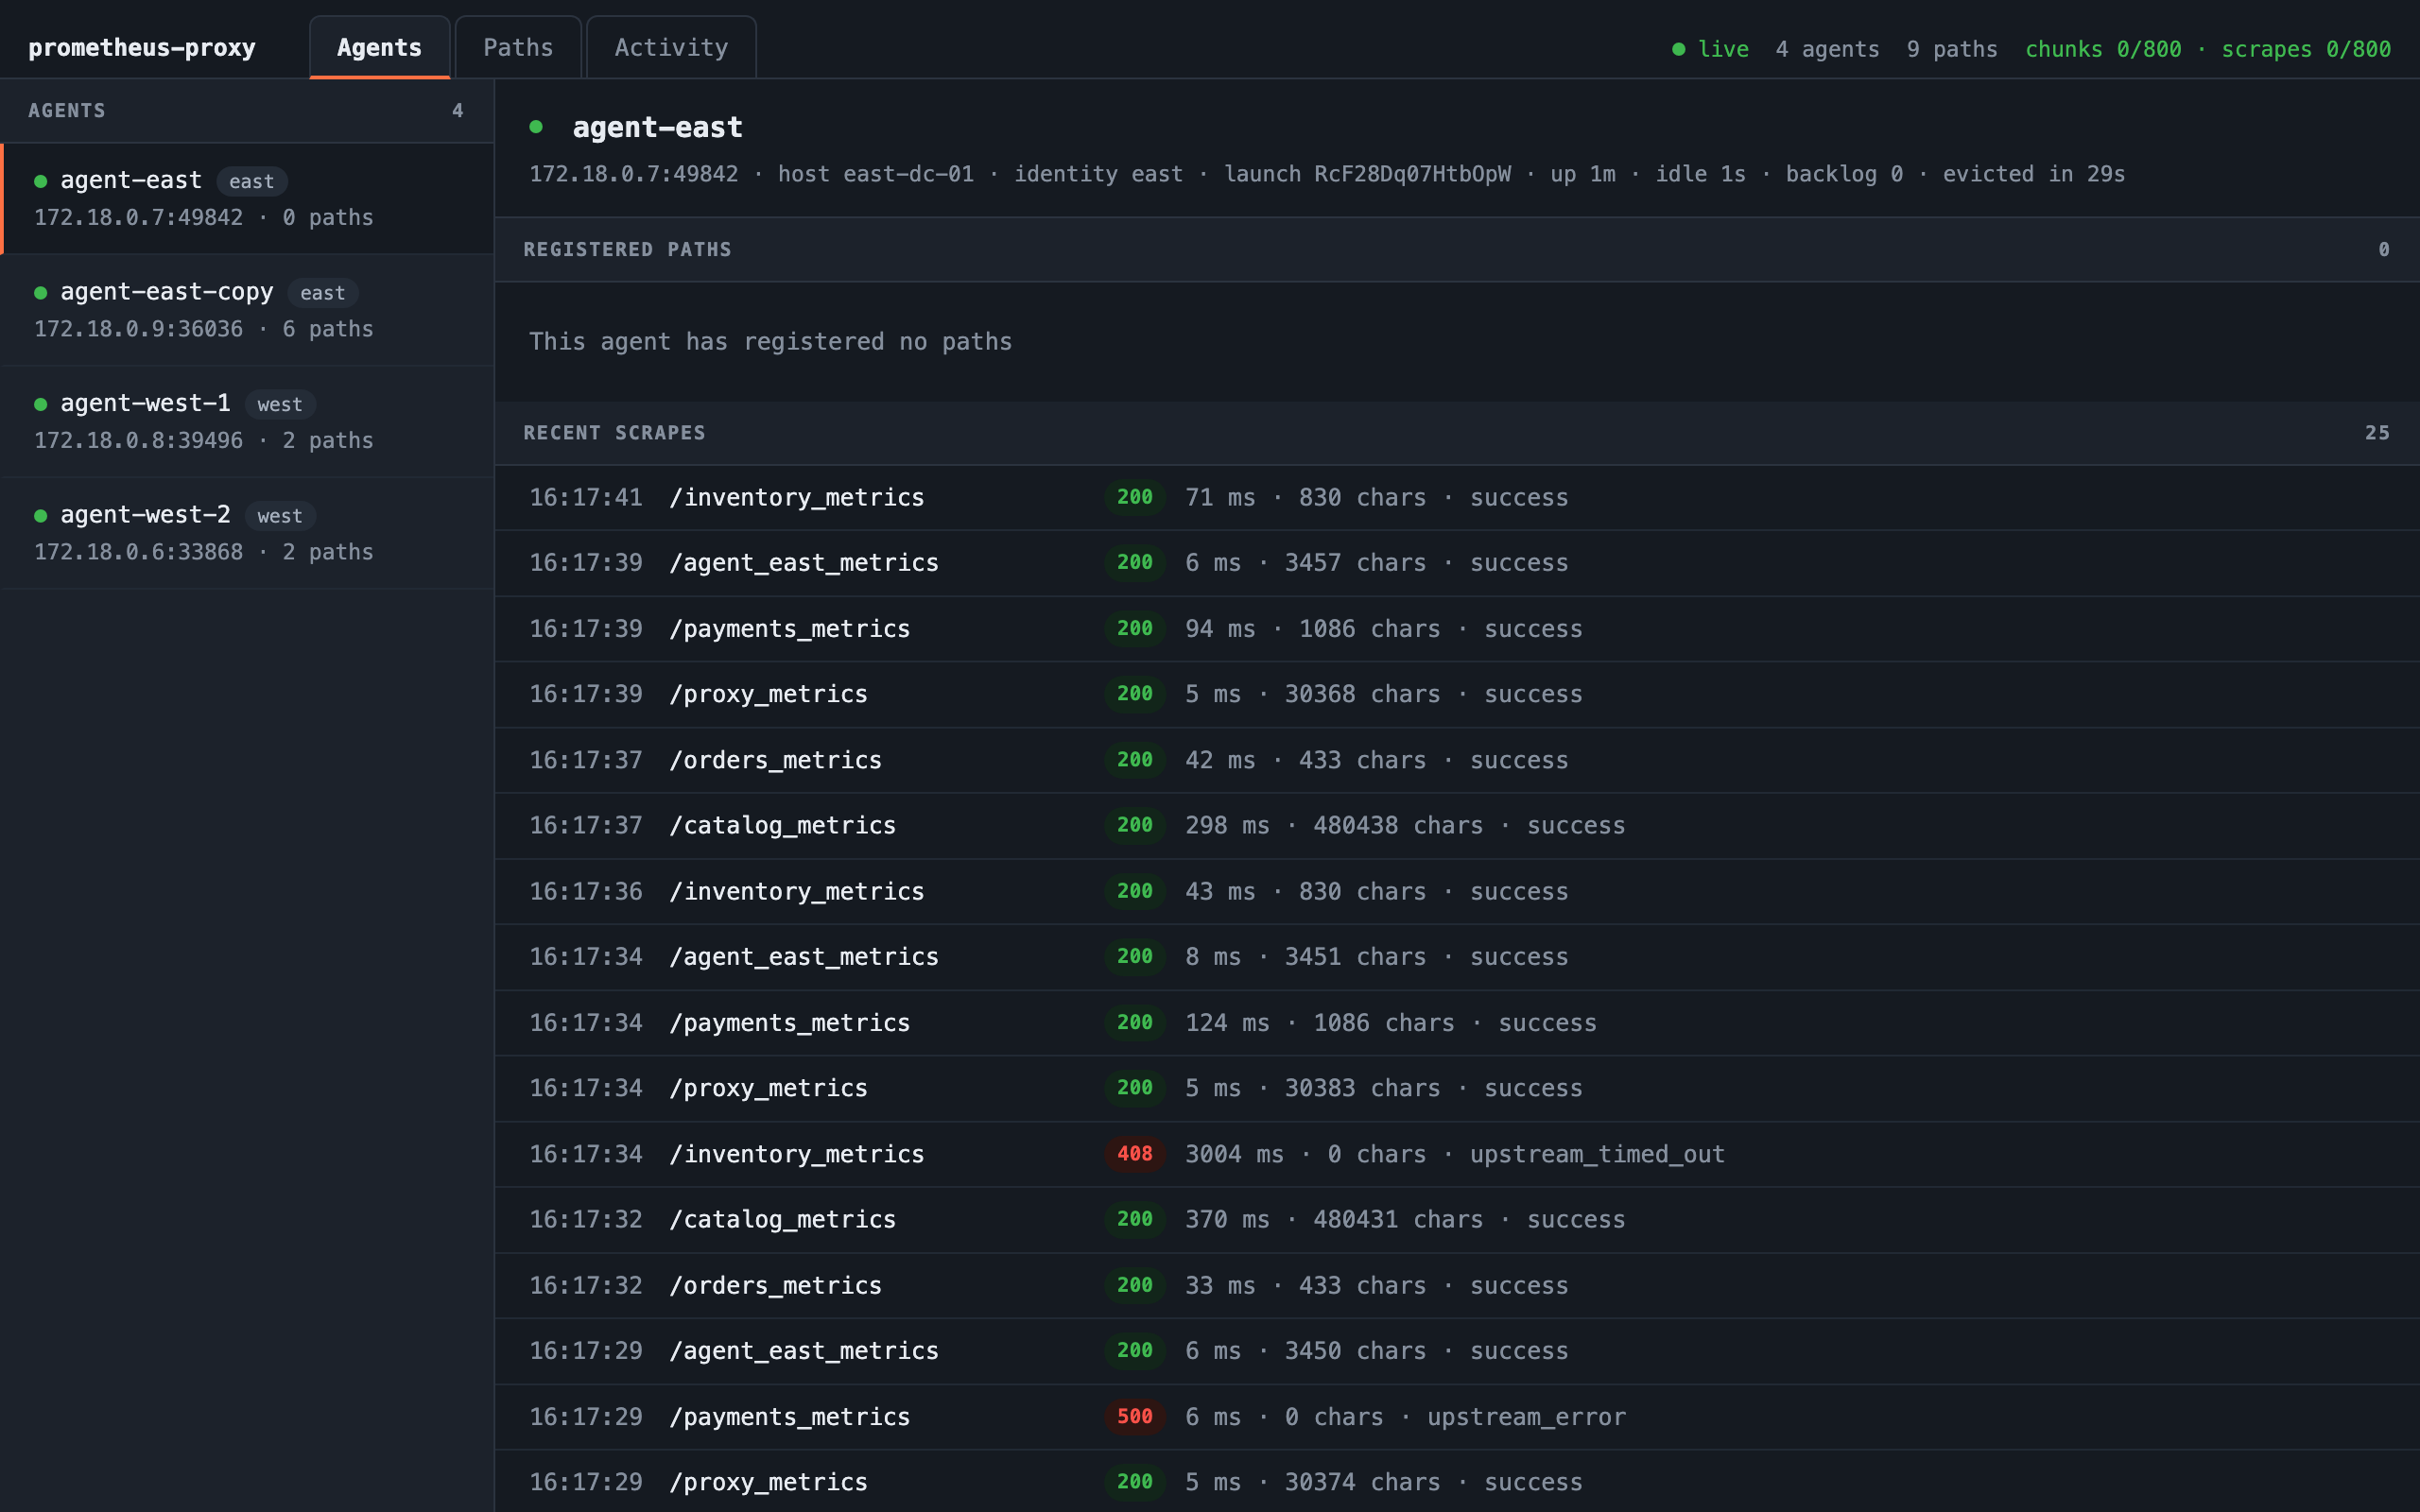
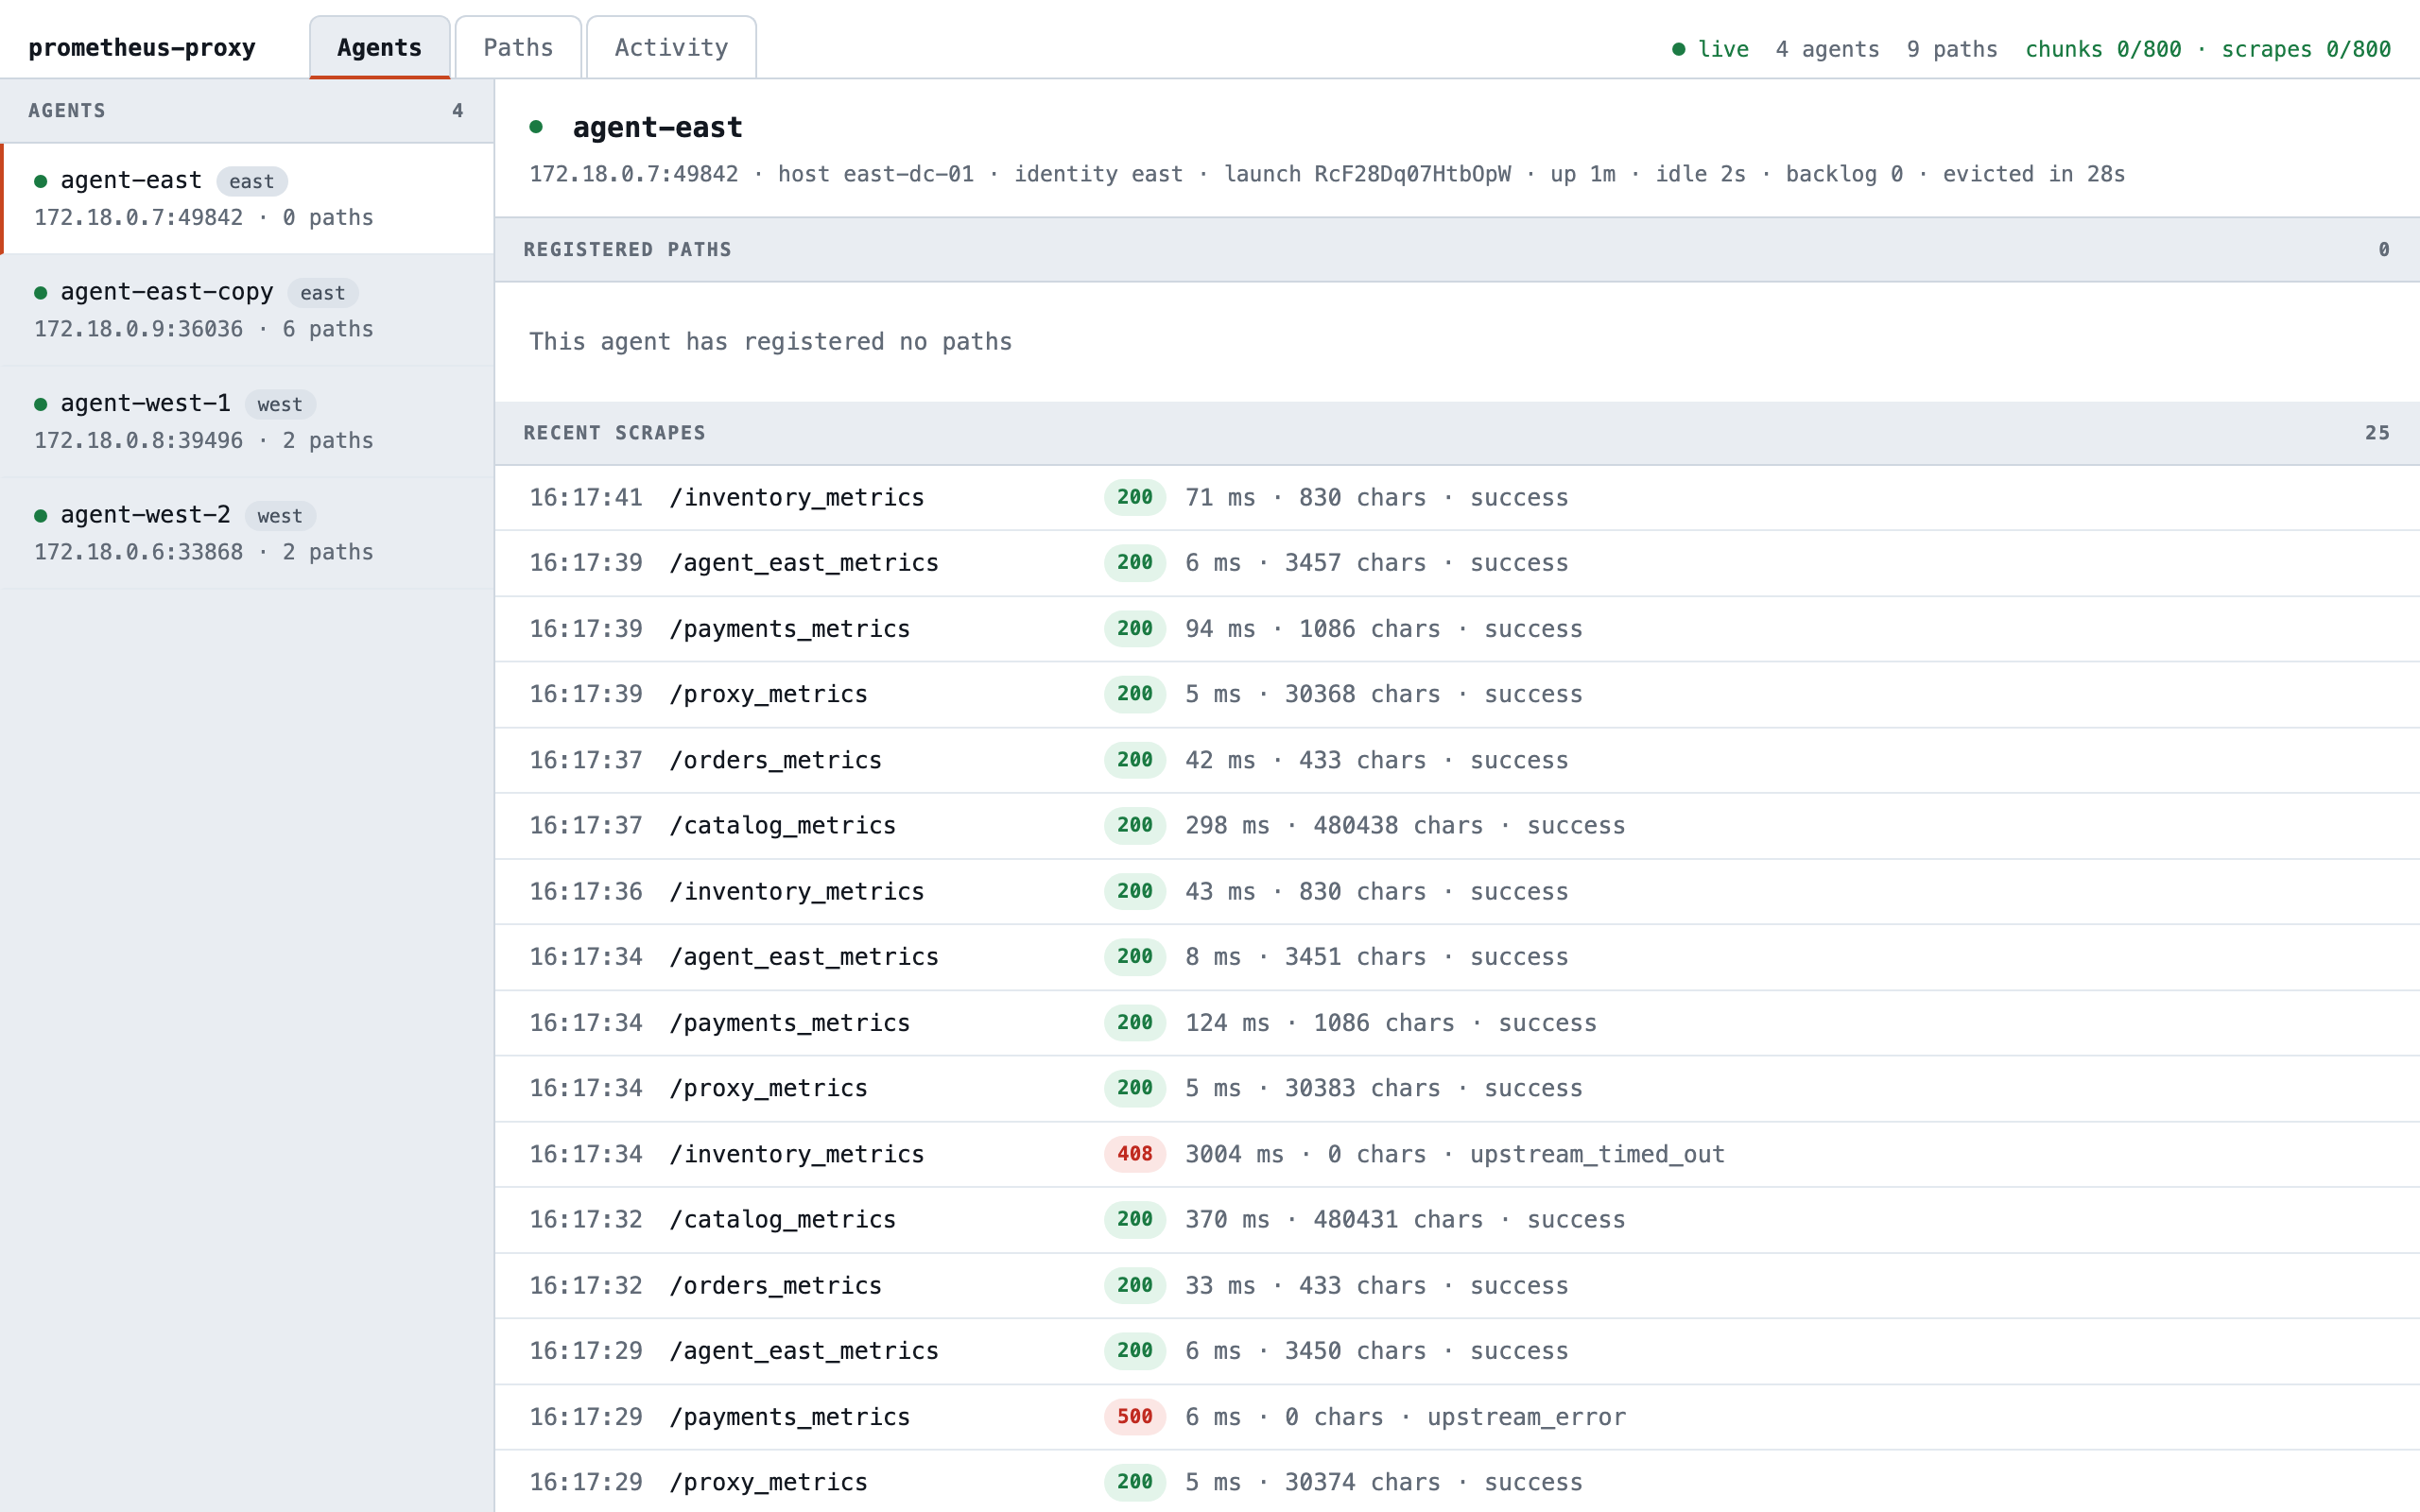
Someone deployed agent-east's config twice. The copy registers the same paths with the same identity, and the newer
registration takes each one: agent-east-copy serves all six, and agent-east stays connected with none. The two
settle; agent-east doesn't reconnect and take the paths back, which used to make two such agents swap them every few
seconds. The command prints the proxy's log line, which names both agents and gives the fix: agent.consolidated =
true on each, if both should serve the paths. ./demo.sh duplicate-agent-stop removes the copy and restarts
agent-east, which registers its paths again.
Scenario reference
| Command | Effect | How it works |
|---|---|---|
demo.sh outage [service] |
The service answers 500 (default payments) |
demo-app's control API: POST /control/<service>/error |
demo.sh slow [service] |
The service hangs past the agent's scrape timeout (default inventory) |
POST /control/<service>/slow: demo-app holds each request 10 seconds, past the agent's 3-second scrapeTimeoutSecs |
demo.sh recover |
Every service returns to normal | POST /control/all/ok |
demo.sh discover / undiscover |
Adds or removes the search, recommendations, and notifications services through agent-east's discovery file | demo-app rewrites /discovery/targets.json, which agent-east re-reads every 5 seconds |
demo.sh agent-stop / agent-start [agent] |
Stops or starts an agent (default agent-west-2) |
docker compose stop / start: the agent's connection closes as it exits |
demo.sh agent-freeze / agent-thaw [agent] |
Pauses or resumes an agent's container (default agent-west-2) |
docker compose pause / unpause: the connection stays open but silent, so the proxy evicts the agent after 30 seconds |
demo.sh rogue-agent / rogue-agent-stop |
Starts or removes the contractor's agent | Starts or removes agent-rogue (compose profile rogue), which presents the contractor identity's token, allowed only contractor_* paths |
demo.sh duplicate-agent / duplicate-agent-stop |
Starts a second copy of agent-east, or removes it and restarts agent-east | Starts or removes agent-east-copy (profile duplicate): agent-east's config under another name, not consolidated |
make tour [PART=n] |
Walks through every scenario, from part 1 or the one given, pausing before each step | |
make status |
The containers, the services' modes, and the URLs | |
make logs [SERVICE=name] |
Follows the logs, of every service or the one given | |
make open |
Opens the dashboard, Grafana, and Prometheus's alerts in the browser |
recover, undiscover, agent-thaw, agent-start, rogue-agent-stop, and duplicate-agent-stop undo every
scenario. For a clean slate, make down && make up.
Going further
- The demo's README has these scenarios as a guided tour, explaining how each one works, and lists the files that set the demo up.
- The Network Demo puts a simulated WAN between the agents and the proxies, and shows what a far, thin, dead, flaky, or missing link does. It also covers what this demo leaves out: the agents failing over to a standby proxy, a filter at the agent that keeps a payload from crossing the firewall, and a call followed through the firewall in Zipkin.
- Dashboard covers every part of the dashboard, and how to turn it on for your own proxy.
- Grafana & Alerting covers the dashboards and alerting rules the project ships.